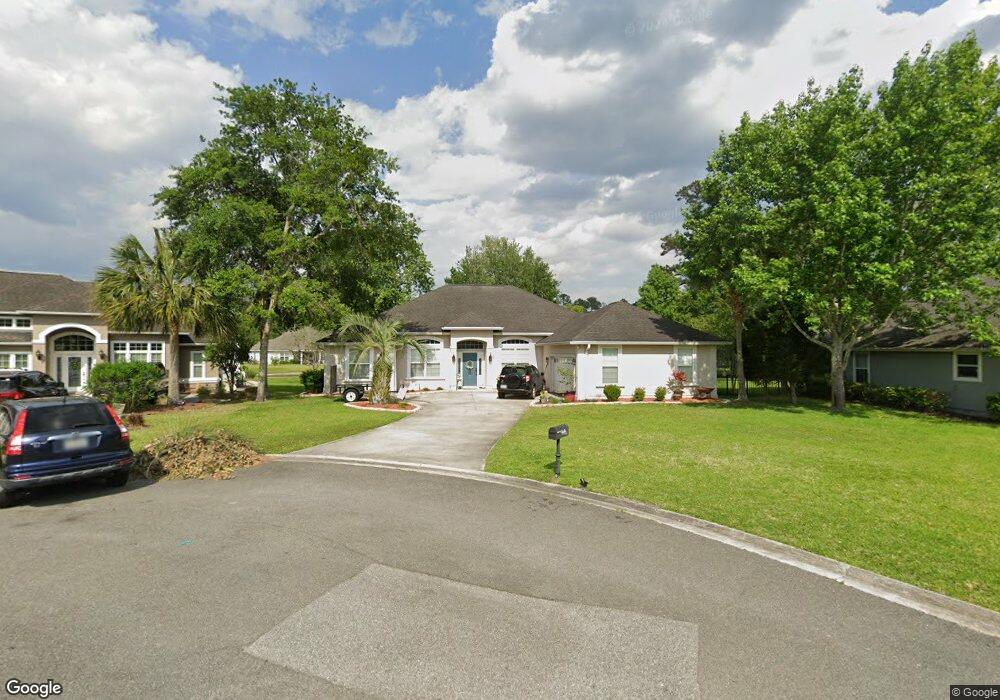
102 Lake View Ct Kingsland, GA 31548
Estimated Value: $387,298 - $473,000
4
Beds
3
Baths
2,281
Sq Ft
$193/Sq Ft
Est. Value
About This Home
This home is located at 102 Lake View Ct, Kingsland, GA 31548 and is currently estimated at $440,325, approximately $193 per square foot. 102 Lake View Ct is a home located in Camden County with nearby schools including Sugarmill Elementary School, Saint Marys Middle School, and Camden County High School.
Ownership History
Date
Name
Owned For
Owner Type
Purchase Details
Closed on
Apr 9, 2021
Sold by
Giesbrecht Travis D
Bought by
Luke Adam M and Luke Cameron M
Current Estimated Value
Home Financials for this Owner
Home Financials are based on the most recent Mortgage that was taken out on this home.
Original Mortgage
$326,340
Outstanding Balance
$292,223
Interest Rate
2.9%
Mortgage Type
VA
Estimated Equity
$148,102
Purchase Details
Closed on
Oct 19, 2006
Sold by
Not Provided
Bought by
Giesbrecht Travis D and Giesbrecht Kathleen O
Home Financials for this Owner
Home Financials are based on the most recent Mortgage that was taken out on this home.
Original Mortgage
$260,000
Interest Rate
6.31%
Mortgage Type
New Conventional
Purchase Details
Closed on
Jul 22, 2005
Sold by
Neighborhoods Of Laurel
Bought by
Regency Custom Homes Inc
Create a Home Valuation Report for This Property
The Home Valuation Report is an in-depth analysis detailing your home's value as well as a comparison with similar homes in the area
Home Values in the Area
Average Home Value in this Area
Purchase History
| Date | Buyer | Sale Price | Title Company |
|---|---|---|---|
| Luke Adam M | $315,000 | -- | |
| Giesbrecht Travis D | $325,000 | -- | |
| Regency Custom Homes Inc | $68,310 | -- |
Source: Public Records
Mortgage History
| Date | Status | Borrower | Loan Amount |
|---|---|---|---|
| Open | Luke Adam M | $326,340 | |
| Previous Owner | Giesbrecht Travis D | $260,000 | |
| Previous Owner | Giesbrecht Travis D | $32,450 |
Source: Public Records
Tax History Compared to Growth
Tax History
| Year | Tax Paid | Tax Assessment Tax Assessment Total Assessment is a certain percentage of the fair market value that is determined by local assessors to be the total taxable value of land and additions on the property. | Land | Improvement |
|---|---|---|---|---|
| 2025 | $4,001 | $138,807 | $14,000 | $124,807 |
| 2024 | $4,210 | $136,360 | $14,000 | $122,360 |
| 2023 | $4,354 | $132,360 | $10,000 | $122,360 |
| 2022 | $4,397 | $122,992 | $10,000 | $112,992 |
| 2021 | $2,860 | $86,884 | $10,000 | $76,884 |
| 2020 | $2,952 | $84,068 | $12,000 | $72,068 |
| 2019 | $2,952 | $84,068 | $12,000 | $72,068 |
| 2018 | $684 | $84,068 | $12,000 | $72,068 |
| 2017 | $2,812 | $78,048 | $12,000 | $66,048 |
| 2016 | $2,147 | $75,701 | $12,000 | $63,701 |
| 2015 | $2,684 | $75,700 | $12,000 | $63,701 |
| 2014 | $2,675 | $75,701 | $12,000 | $63,701 |
Source: Public Records
Map
Nearby Homes
- 102 Herons Nest Cir
- 151 Laurel Marsh Way
- 112 Justin Cole Dr
- 103 Renee Dr
- 204 Laurel Landing Blvd
- 107 Amanda Trc
- 125 Fiddlers Cove Dr
- 134 Bryce Ryan Cir
- 136 Bryce Ryan Cir
- 121 Amanda Trace
- 132 Brookshire Green Ct
- Huntington Plan at Brookshire Green
- Memphis Plan at Brookshire Green
- Harmony Plan at Brookshire Green
- Wilmington Plan at Brookshire Green
- Drexel Plan at Brookshire Green
- 301 Overlook Bend
- 133 Amanda Trace
- 137 Amanda Trace
- 131 Amanda Trc
- 104 Lake View Ct
- 100 Lake View Ct
- 0 Woodstork Place Unit 3108874
- 0 Woodstork Place Unit 10495332
- 0 Woodstork Place Unit 1653118
- 0 Woodstork Place Unit 10407684
- 0 Woodstork Place Unit 1650017
- 0 Woodstork Place Unit 1647623
- 0 Woodstork Place Unit 10332670
- 0 Woodstork Place Unit 10297413
- 0 Woodstork Place Unit 1646567
- 0 Woodstork Place Unit 1555222
- 0 Woodstork Place Unit 25 9075685
- 0 Woodstork Place Unit 23 8196985
- 109 Herons Nest Cir
- 107 Lake View Ct
- 103 Lake View Ct
- 103 Lake View Ct
- 111 Herons Nest Cir
- 101 Lake View Ct