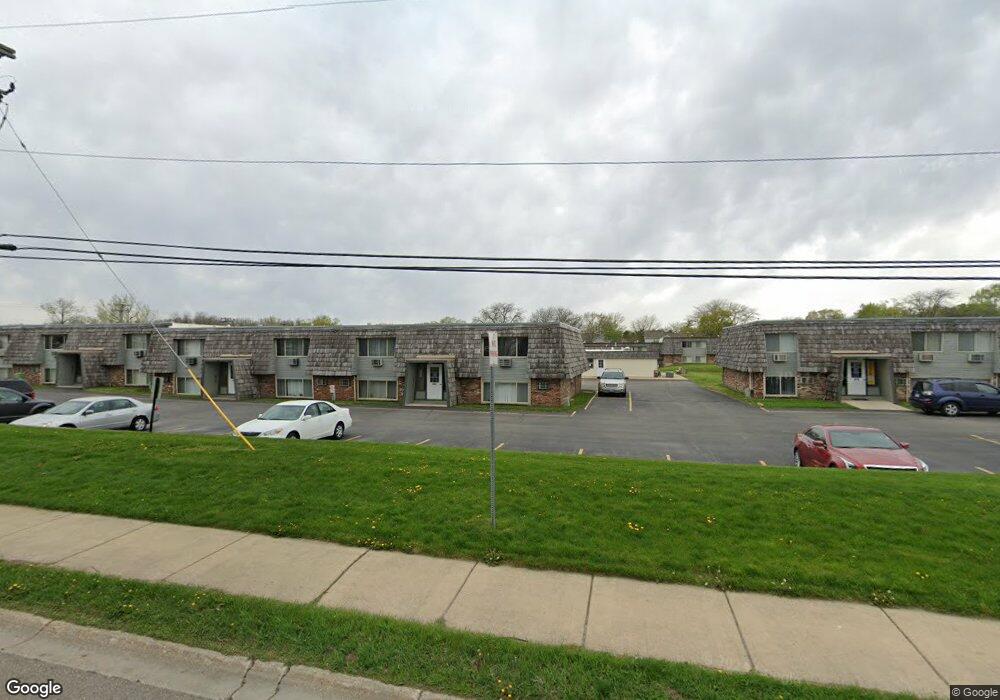
102 Laurel Dr North Aurora, IL 60542
Estimated Value: $9,062,695
--
Bed
--
Bath
76,670
Sq Ft
$118/Sq Ft
Est. Value
About This Home
This home is located at 102 Laurel Dr, North Aurora, IL 60542 and is currently estimated at $9,062,695, approximately $118 per square foot. 102 Laurel Dr is a home located in Kane County with nearby schools including Schneider Elementary School, Herget Middle School, and West Aurora High School.
Ownership History
Date
Name
Owned For
Owner Type
Purchase Details
Closed on
Nov 5, 2021
Sold by
Konopacki Anthony A
Bought by
Everyday Management Llc and Butterfield Trail Apartments Llc
Current Estimated Value
Purchase Details
Closed on
Feb 10, 2005
Sold by
Streit Edward F and Streit Edward F
Bought by
Konopacki Anthony
Home Financials for this Owner
Home Financials are based on the most recent Mortgage that was taken out on this home.
Original Mortgage
$5,675,000
Interest Rate
5.78%
Mortgage Type
Commercial
Purchase Details
Closed on
Aug 27, 2001
Sold by
Butterfield Trails Ltd Partnership
Bought by
Streit Edward F
Home Financials for this Owner
Home Financials are based on the most recent Mortgage that was taken out on this home.
Original Mortgage
$3,867,000
Interest Rate
7.03%
Mortgage Type
Commercial
Create a Home Valuation Report for This Property
The Home Valuation Report is an in-depth analysis detailing your home's value as well as a comparison with similar homes in the area
Home Values in the Area
Average Home Value in this Area
Purchase History
| Date | Buyer | Sale Price | Title Company |
|---|---|---|---|
| Everyday Management Llc | -- | None Available | |
| Konopacki Anthony | $5,675,000 | Chicago Title Insurance Comp | |
| Streit Edward F | $4,550,000 | Chicago Title Insurance Co |
Source: Public Records
Mortgage History
| Date | Status | Borrower | Loan Amount |
|---|---|---|---|
| Previous Owner | Konopacki Anthony | $3,850,000 | |
| Previous Owner | Konopacki Anthony | $5,675,000 | |
| Previous Owner | Konopacki Anthony | $5,675,000 | |
| Previous Owner | Streit Edward F | $1,000,000 | |
| Previous Owner | Streit Edward F | $3,867,000 |
Source: Public Records
Tax History Compared to Growth
Tax History
| Year | Tax Paid | Tax Assessment Tax Assessment Total Assessment is a certain percentage of the fair market value that is determined by local assessors to be the total taxable value of land and additions on the property. | Land | Improvement |
|---|---|---|---|---|
| 2024 | $156,846 | $2,060,778 | $577,780 | $1,482,998 |
| 2023 | $151,775 | $1,841,296 | $516,244 | $1,325,052 |
| 2022 | $140,764 | $1,680,015 | $471,026 | $1,208,989 |
| 2021 | $135,072 | $1,564,114 | $438,531 | $1,125,583 |
| 2020 | $127,831 | $1,452,828 | $407,330 | $1,045,498 |
| 2019 | $138,715 | $1,499,448 | $377,402 | $1,122,046 |
| 2018 | $138,216 | $1,444,145 | $349,091 | $1,095,054 |
| 2017 | $131,022 | $1,330,641 | $321,654 | $1,008,987 |
| 2016 | $134,125 | $1,320,930 | $275,719 | $1,045,211 |
| 2015 | $141,350 | $1,139,847 | $237,096 | $902,751 |
| 2014 | $141,350 | $1,192,128 | $217,899 | $974,229 |
| 2013 | $141,350 | $1,367,226 | $214,797 | $1,152,429 |
Source: Public Records
Map
Nearby Homes
- 202 Linn Ct Unit C
- 203 Lilac Ln
- 302 Dee Rd
- 122 E State St
- 114 Briar Ln Unit 2
- 925 Darwin St
- 24 S Grant St
- 606 Holly Ct
- 254 Ridge Rd
- 148 N Lincolnway
- 12 N Lincolnway
- 21 S Adams St
- 313 Carrie Ct
- 321 Ridley St
- 276 Durham St
- 218 Timber Oaks Dr
- 616 Pinehurst Dr
- 306 Harmony Dr
- 302 Mooseheart Rd
- 307 John St