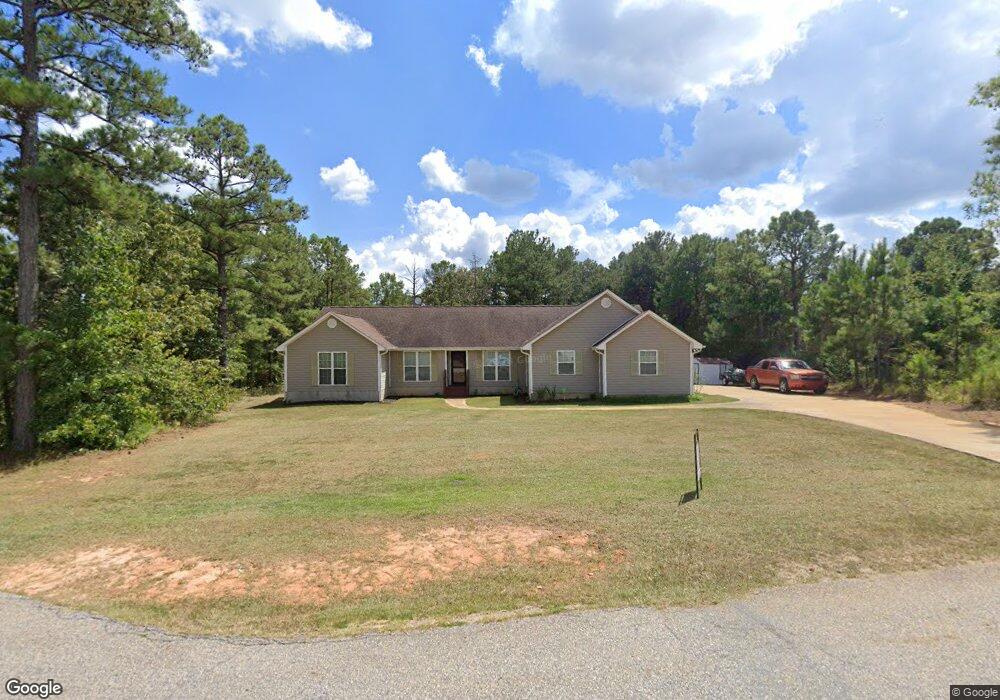
102 Martha's Loop Unit LOT 7 Cusseta, GA 31805
Estimated Value: $241,000 - $353,000
4
Beds
3
Baths
2,148
Sq Ft
$128/Sq Ft
Est. Value
About This Home
This home is located at 102 Martha's Loop Unit LOT 7, Cusseta, GA 31805 and is currently estimated at $275,883, approximately $128 per square foot. 102 Martha's Loop Unit LOT 7 is a home located in Chattahoochee County with nearby schools including Chattahoochee County Education Center, Chattahoochee County Middle School, and Chattahoochee County High School.
Ownership History
Date
Name
Owned For
Owner Type
Purchase Details
Closed on
Jul 15, 2024
Sold by
Taylor Audra
Bought by
Weible Jason Robert and Weible Jessica M
Current Estimated Value
Home Financials for this Owner
Home Financials are based on the most recent Mortgage that was taken out on this home.
Original Mortgage
$258,250
Outstanding Balance
$255,142
Interest Rate
6.95%
Mortgage Type
New Conventional
Estimated Equity
$20,741
Purchase Details
Closed on
Feb 23, 2006
Sold by
Taylor Audra
Bought by
Allen Andre L
Home Financials for this Owner
Home Financials are based on the most recent Mortgage that was taken out on this home.
Original Mortgage
$172,000
Interest Rate
8.05%
Mortgage Type
New Conventional
Purchase Details
Closed on
Jul 26, 2005
Sold by
Cypress Meadows Inc
Bought by
Taylor Audra
Create a Home Valuation Report for This Property
The Home Valuation Report is an in-depth analysis detailing your home's value as well as a comparison with similar homes in the area
Home Values in the Area
Average Home Value in this Area
Purchase History
| Date | Buyer | Sale Price | Title Company |
|---|---|---|---|
| Weible Jason Robert | $250,000 | -- | |
| Allen Andre L | -- | -- | |
| Taylor Audra | $21,500 | -- |
Source: Public Records
Mortgage History
| Date | Status | Borrower | Loan Amount |
|---|---|---|---|
| Open | Weible Jason Robert | $258,250 | |
| Previous Owner | Allen Andre L | $172,000 |
Source: Public Records
Tax History Compared to Growth
Tax History
| Year | Tax Paid | Tax Assessment Tax Assessment Total Assessment is a certain percentage of the fair market value that is determined by local assessors to be the total taxable value of land and additions on the property. | Land | Improvement |
|---|---|---|---|---|
| 2024 | -- | $69,118 | $6,000 | $63,118 |
| 2023 | $0 | $69,008 | $6,000 | $63,008 |
| 2022 | $1,372 | $53,419 | $6,000 | $47,419 |
| 2021 | $1,350 | $53,419 | $6,000 | $47,419 |
| 2020 | $1,353 | $53,419 | $6,000 | $47,419 |
| 2019 | $1,353 | $53,419 | $6,000 | $47,419 |
| 2018 | $1,350 | $53,419 | $6,000 | $47,419 |
| 2017 | $1,319 | $53,419 | $6,000 | $47,419 |
| 2016 | $1,375 | $53,419 | $6,000 | $47,419 |
| 2015 | -- | $53,419 | $6,000 | $47,419 |
| 2013 | -- | $53,419 | $6,000 | $47,419 |
Source: Public Records
Map
Nearby Homes
- 0 Firetower Rd Unit 10582383
- 0 Firetower Rd Unit 222797
- 00 0 St
- 0 Georgia 26
- 412 Georgia 137
- 105 Magnolia Ln
- 111 Magnolia Ln Unit 6
- 729B Ga Highway 26
- 103 S Magnolia
- 151 Gordy Mill Pond Rd
- 0 Street 0 St
- 153 Gordy Mill Pond Rd
- 241 Lafayette Rd
- 145 Patty Dr
- 188 Lafayette Rd
- 0 Georgia 355
- 0 Old Louvale Rd Unit 206224
- 105 Magnolia
- 101 S Magnolia
- 1455 Mcallister Rd
- 102 Martha's Loop
- 102 Marthas Loop
- 2225 Martha's Loop
- 2429 Martha's Loop
- 2305 Martha's Loop
- 2301 Martha's Loop
- 2307 Martha's Loop
- 2458 & 2464 Martha's Loop
- 2419 Martha's Loop
- 100 Marthas Loop
- 106 Marthas Loop
- 103 Martha's Loop
- 103 Marthas Loop
- 101 Marthas Loop
- 271 Firetower Rd
- 106 Felicia Ruth Dr
- 106 Felecia Ruth Dr
- 315 Firetower Rd
- 410 Firetower Rd
- 0 Firetower Rd Unit 10458000