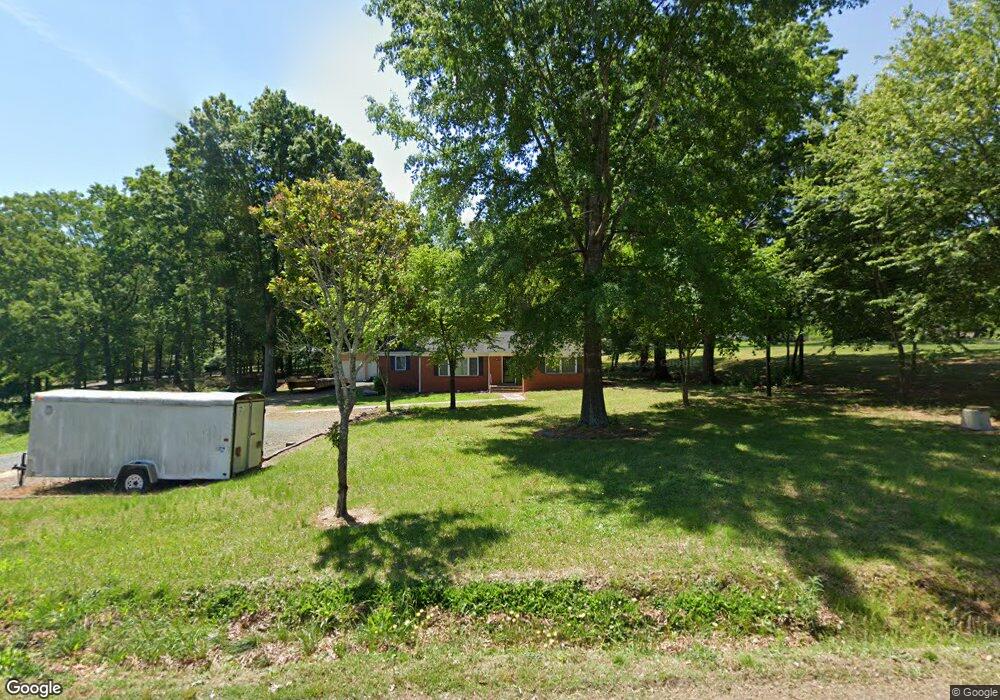
102 Montgomery Ave Stanfield, NC 28163
Estimated Value: $355,374 - $373,000
3
Beds
1
Bath
1,864
Sq Ft
$197/Sq Ft
Est. Value
About This Home
This home is located at 102 Montgomery Ave, Stanfield, NC 28163 and is currently estimated at $367,594, approximately $197 per square foot. 102 Montgomery Ave is a home located in Stanly County with nearby schools including Stanfield Elementary School, West Stanly Middle School, and West Stanly High School.
Ownership History
Date
Name
Owned For
Owner Type
Purchase Details
Closed on
Jan 10, 2018
Sold by
Fuller Lecsa C and Fuller Tyree
Bought by
Fuller Leesa C and Fuller Patrick E
Current Estimated Value
Purchase Details
Closed on
Feb 21, 2008
Sold by
Bowen James D and Bowen Dorothy P
Bought by
Tyree Leesa C
Create a Home Valuation Report for This Property
The Home Valuation Report is an in-depth analysis detailing your home's value as well as a comparison with similar homes in the area
Home Values in the Area
Average Home Value in this Area
Purchase History
| Date | Buyer | Sale Price | Title Company |
|---|---|---|---|
| Fuller Leesa C | -- | None Available | |
| Tyree Leesa C | $82,000 | None Available |
Source: Public Records
Tax History Compared to Growth
Tax History
| Year | Tax Paid | Tax Assessment Tax Assessment Total Assessment is a certain percentage of the fair market value that is determined by local assessors to be the total taxable value of land and additions on the property. | Land | Improvement |
|---|---|---|---|---|
| 2025 | $2,507 | $263,911 | $42,622 | $221,289 |
| 2024 | $1,889 | $179,879 | $25,186 | $154,693 |
| 2023 | $1,889 | $179,879 | $25,186 | $154,693 |
| 2022 | $1,871 | $179,879 | $25,186 | $154,693 |
| 2021 | $1,853 | $179,879 | $25,186 | $154,693 |
| 2020 | $1,411 | $130,767 | $21,311 | $109,456 |
| 2019 | $1,425 | $130,767 | $21,311 | $109,456 |
| 2018 | $1,425 | $130,767 | $21,311 | $109,456 |
| 2017 | $1,425 | $130,767 | $21,311 | $109,456 |
| 2016 | $1,399 | $128,304 | $19,761 | $108,543 |
| 2015 | $1,204 | $110,927 | $19,761 | $91,166 |
| 2014 | $947 | $110,927 | $19,761 | $91,166 |
Source: Public Records
Map
Nearby Homes
- 000 S Love Chapel Rd
- 101 Charlotte St
- 177 Park View Dr
- 0 N Carolina 200
- 4034 N Carolina 200
- 4036 N Carolina 200
- 00 W Stanly St
- 201 Oak St
- 4152 River Rd Unit A, B & C
- 174 Willow Creek Dr
- 12069 Coyle Rd
- 556 Big Lick Rd
- 27 Berea Baptist Church Rd
- 103 Berea Baptist Church Rd
- 105 Berea Baptist Church Rd
- 000 N Renee Ford Rd
- 708 Redah Ave
- 331 Polk Ford Rd
- 540 Church St
- 12005 Saddle Back Trail
- 498 S Love Chapel Rd
- 104 Fieldcrest Dr
- 106 Fieldcrest Dr
- 103 Fieldcrest Dr
- 108 Fieldcrest Dr
- 203 Pleasant Ave
- 110 Fieldcrest Dr
- 101 Fieldcrest Dr
- 102 Fieldcrest Dr
- 402 S Love Chapel Rd
- 401 S Love Chapel Rd
- 304 S Love Chapel Rd
- 404 S Love Chapel Rd
- 302 S Love Chapel Rd
- 205 Pleasant Ave
- 220 S Love Chapel Rd
- 201 Love St
- 403 S Love Chapel Rd
- 195 Love St
- 203 S Love Chapel Rd