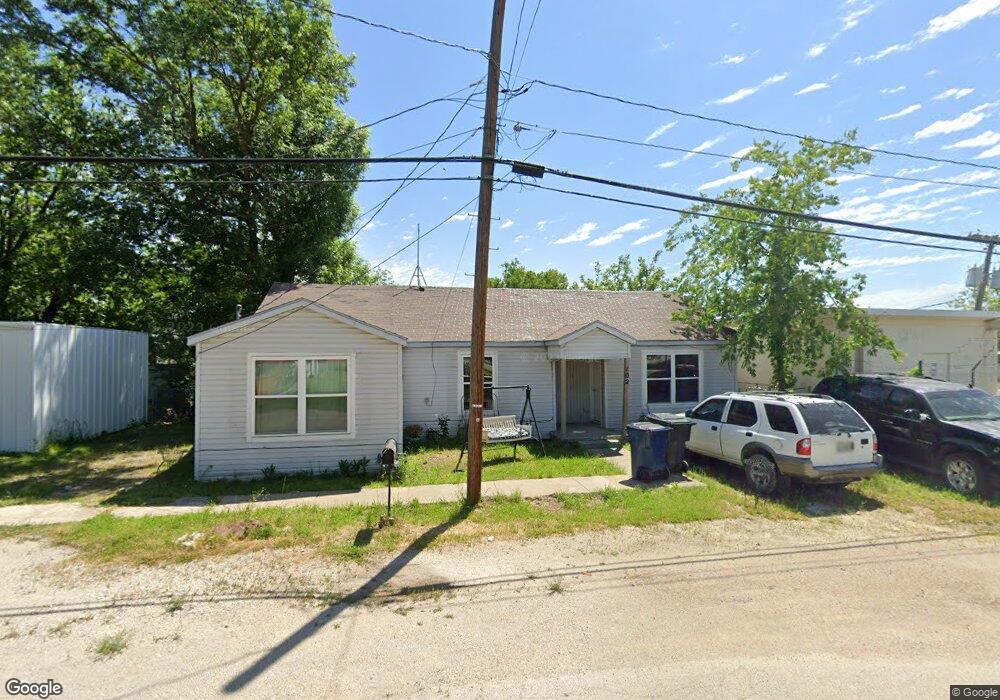
102 N 3rd St Sanger, TX 76266
Estimated Value: $181,923 - $246,000
3
Beds
1
Bath
1,348
Sq Ft
$159/Sq Ft
Est. Value
About This Home
This home is located at 102 N 3rd St, Sanger, TX 76266 and is currently estimated at $213,981, approximately $158 per square foot. 102 N 3rd St is a home located in Denton County with nearby schools including Butterfield Elementary School, Clear Creek Intermediate School, and Sanger Sixth Grade Campus.
Ownership History
Date
Name
Owned For
Owner Type
Purchase Details
Closed on
Jul 22, 2014
Sold by
Anderson Richard J and Anderson Joni
Bought by
Garcia Dina
Current Estimated Value
Purchase Details
Closed on
Jul 19, 2014
Sold by
Anderson Jessica A
Bought by
Anderson Jesse S
Purchase Details
Closed on
Sep 5, 2003
Sold by
Manning David and Manning Lisa
Bought by
Anderson Richard J and Anderson Jesse L
Home Financials for this Owner
Home Financials are based on the most recent Mortgage that was taken out on this home.
Original Mortgage
$59,377
Interest Rate
6.08%
Mortgage Type
FHA
Create a Home Valuation Report for This Property
The Home Valuation Report is an in-depth analysis detailing your home's value as well as a comparison with similar homes in the area
Home Values in the Area
Average Home Value in this Area
Purchase History
| Date | Buyer | Sale Price | Title Company |
|---|---|---|---|
| Garcia Dina | -- | None Available | |
| Anderson Jesse S | -- | None Available | |
| Anderson Richard J | -- | -- |
Source: Public Records
Mortgage History
| Date | Status | Borrower | Loan Amount |
|---|---|---|---|
| Previous Owner | Anderson Richard J | $59,377 |
Source: Public Records
Tax History Compared to Growth
Tax History
| Year | Tax Paid | Tax Assessment Tax Assessment Total Assessment is a certain percentage of the fair market value that is determined by local assessors to be the total taxable value of land and additions on the property. | Land | Improvement |
|---|---|---|---|---|
| 2025 | $1,617 | $89,000 | $42,012 | $46,988 |
| 2024 | $1,617 | $80,000 | $42,012 | $37,988 |
| 2023 | $1,694 | $83,576 | $32,676 | $50,900 |
| 2022 | $2,128 | $95,945 | $25,674 | $70,271 |
| 2021 | $1,087 | $81,451 | $21,006 | $60,445 |
| 2020 | $1,040 | $47,000 | $21,006 | $25,994 |
| 2019 | $1,366 | $60,000 | $21,006 | $38,994 |
| 2018 | $1,373 | $60,000 | $21,006 | $38,994 |
| 2017 | $1,495 | $65,000 | $21,006 | $43,994 |
| 2016 | $1,316 | $57,233 | $11,670 | $45,563 |
| 2015 | $1,148 | $52,924 | $11,670 | $41,254 |
| 2014 | $1,148 | $49,384 | $11,670 | $37,714 |
| 2013 | -- | $49,240 | $11,670 | $37,570 |
Source: Public Records
Map
Nearby Homes
- 109 S 5th St
- 509 Marshall St
- 710 W Willow St
- 319 Austin St
- 702 Peach St Unit 2
- 505 Houston St
- 902 Plum St
- 1010 Bolivar St
- 136 Creekside Dr
- 10 Covey Ln
- 37 Pleasant Valley
- 175 Creekside Dr
- 6 Covey Ln
- 182 Creekside Dr
- 5 Pheasant Run
- 4 Covey Ln
- 109 Colonial Heights
- 126 Creekside Dr
- 1209 Bolivar St
- 189 Creekside Dr