102 N Broad St Winder, GA 30680
Estimated Value: $1,454,838
--
Bed
--
Bath
6,277
Sq Ft
$232/Sq Ft
Est. Value
About This Home
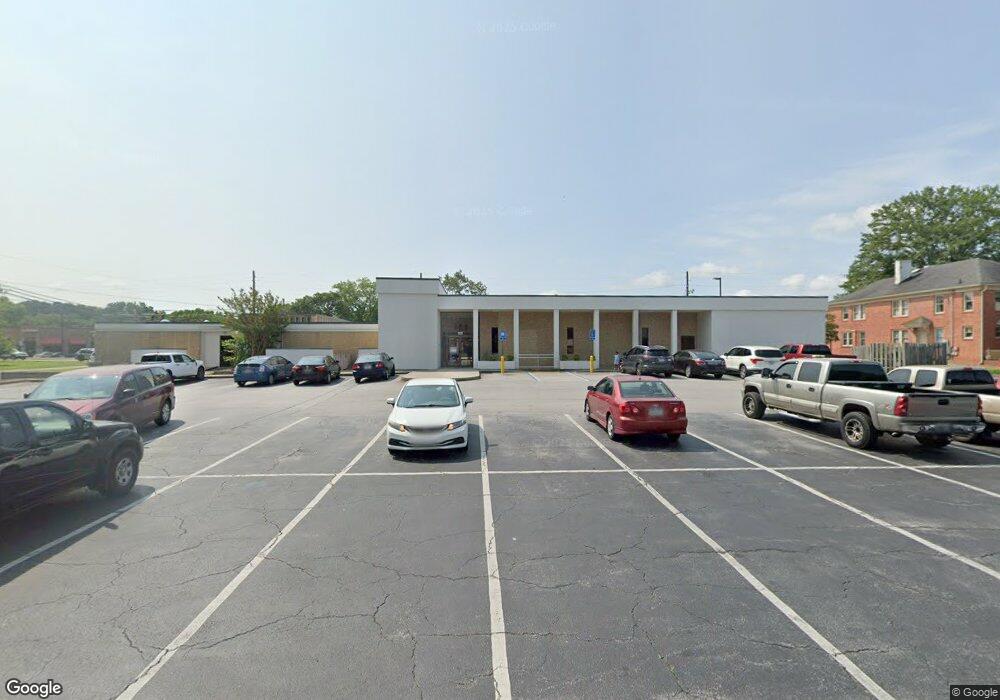
This home is located at 102 N Broad St, Winder, GA 30680 and is currently estimated at $1,454,838, approximately $231 per square foot. 102 N Broad St is a home located in Barrow County with nearby schools including County Line Elementary School, Russell Middle School, and Winder-Barrow High School.
Ownership History
Date
Name
Owned For
Owner Type
Purchase Details
Closed on
Jun 25, 2021
Sold by
Begnaud Properties Llc
Bought by
102 North Broad Associates Llc
Current Estimated Value
Home Financials for this Owner
Home Financials are based on the most recent Mortgage that was taken out on this home.
Original Mortgage
$700,000
Interest Rate
2.9%
Mortgage Type
Commercial
Purchase Details
Closed on
Sep 5, 2019
Sold by
Middour John Owen
Bought by
Begnaud Properties Llc
Purchase Details
Closed on
Sep 28, 2017
Sold by
George T
Bought by
Middour John Owen and Cone Ryan C
Purchase Details
Closed on
Sep 20, 2017
Sold by
George T
Bought by
Koury George T and Midour John Owen
Purchase Details
Closed on
Jun 20, 2013
Sold by
Gpt Gig Boa Portfolio H
Bought by
Koury George
Purchase Details
Closed on
Dec 7, 2012
Sold by
First States Investors 500
Bought by
Gpt Gig Boa Portfolio H and C/O Gramercy Capital Corp
Create a Home Valuation Report for This Property
The Home Valuation Report is an in-depth analysis detailing your home's value as well as a comparison with similar homes in the area
Home Values in the Area
Average Home Value in this Area
Purchase History
| Date | Buyer | Sale Price | Title Company |
|---|---|---|---|
| 102 North Broad Associates Llc | -- | -- | |
| 102 North Broad Associates Llc | $1,036,000 | -- | |
| Begnaud Properties Llc | $750,000 | -- | |
| Middour John Owen | -- | -- | |
| Koury George T | $690,000 | -- | |
| Koury George | $372,750 | -- | |
| Gpt Gig Boa Portfolio H | $277,680 | -- |
Source: Public Records
Mortgage History
| Date | Status | Borrower | Loan Amount |
|---|---|---|---|
| Closed | 102 North Broad Associates Llc | $700,000 |
Source: Public Records
Tax History Compared to Growth
Tax History
| Year | Tax Paid | Tax Assessment Tax Assessment Total Assessment is a certain percentage of the fair market value that is determined by local assessors to be the total taxable value of land and additions on the property. | Land | Improvement |
|---|---|---|---|---|
| 2024 | $9,569 | $340,670 | $32,358 | $308,312 |
| 2023 | $11,217 | $340,670 | $32,358 | $308,312 |
| 2022 | $16,758 | $340,670 | $56,300 | $284,370 |
| 2021 | $13,506 | $379,675 | $60,000 | $319,675 |
| 2020 | $8,254 | $379,675 | $60,000 | $319,675 |
| 2019 | $12,844 | $379,675 | $60,000 | $319,675 |
| 2018 | $7,459 | $385,915 | $60,000 | $325,915 |
| 2017 | $9,435 | $316,234 | $60,000 | $256,234 |
| 2016 | $8,978 | $270,220 | $60,000 | $210,220 |
| 2015 | $8,988 | $270,220 | $60,000 | $210,220 |
| 2014 | $4,070 | $243,820 | $33,600 | $210,220 |
| 2013 | -- | $230,624 | $29,400 | $201,224 |
Source: Public Records
Map
Nearby Homes
- 116 N Broad St
- 92 Woodlawn Ave
- 0 Georgia Highway 211 Unit 7483562
- 0 W Athens St Unit 10544465
- 102 N Center St
- 15 E New St
- 19 Holland Cove
- 25 Holland Cove
- 18 E New St
- 0 Jerome St Unit 7439149
- 0 Jerome St Unit 10359679
- 253 3rd Ave
- 122 Capitol Ave
- 17 W Wright St
- 209 Georgia Ave
- 311 2nd Ave
- 256 4th Ave
- 217 Bellview St
- 120 N Williamson St
- 165 Shields St
- 20 W Stephens St
- 13 W Stephens St
- 110 N Broad St
- 101 N Broad St
- 0 W Stephens St
- W W Stephens St
- 284 Po Box 1131 St
- 17 W Stephens St
- 284 Po Box 1131
- 24 W Stephens St
- 114 N Broad St
- 15 W Midland Ave
- 113 N Broad St
- 30 W Stephens St
- 99 Woodlawn Ave
- 0 W Midland Ave Unit 8214397
- 00 W Midland Ave
- 0 W Midland Ave Unit 8221626
- 25 W Stephens St
- 83 Woodlawn Ave