102 N Harbors End Dr Unit 18A Port Clinton, OH 43452
Estimated Value: $287,000 - $304,000
2
Beds
2
Baths
1,485
Sq Ft
$198/Sq Ft
Est. Value
About This Home
This home is located at 102 N Harbors End Dr Unit 18A, Port Clinton, OH 43452 and is currently estimated at $294,405, approximately $198 per square foot. 102 N Harbors End Dr Unit 18A is a home located in Ottawa County with nearby schools including Bataan Memorial Primary School, Bataan Memorial Intermediate School, and Port Clinton Middle School.
Ownership History
Date
Name
Owned For
Owner Type
Purchase Details
Closed on
May 11, 2022
Sold by
Saponari Maureen M
Bought by
Findish Robert G and Findish Deborah L
Current Estimated Value
Purchase Details
Closed on
Aug 22, 2019
Sold by
Dunham Julie L and Susan A Pope Living Trust
Bought by
Saponari Maureen M
Home Financials for this Owner
Home Financials are based on the most recent Mortgage that was taken out on this home.
Original Mortgage
$124,000
Interest Rate
3.7%
Mortgage Type
Purchase Money Mortgage
Purchase Details
Closed on
Oct 2, 1995
Sold by
Hagy Carol A
Bought by
Mazur Laurie J
Home Financials for this Owner
Home Financials are based on the most recent Mortgage that was taken out on this home.
Original Mortgage
$83,700
Interest Rate
8%
Mortgage Type
New Conventional
Create a Home Valuation Report for This Property
The Home Valuation Report is an in-depth analysis detailing your home's value as well as a comparison with similar homes in the area
Home Values in the Area
Average Home Value in this Area
Purchase History
| Date | Buyer | Sale Price | Title Company |
|---|---|---|---|
| Findish Robert G | $238,000 | Hartung Title | |
| Saponari Maureen M | $125,000 | Hartung Title Order | |
| Mazur Laurie J | $93,000 | -- |
Source: Public Records
Mortgage History
| Date | Status | Borrower | Loan Amount |
|---|---|---|---|
| Previous Owner | Saponari Maureen M | $124,000 | |
| Previous Owner | Mazur Laurie J | $83,700 |
Source: Public Records
Tax History Compared to Growth
Tax History
| Year | Tax Paid | Tax Assessment Tax Assessment Total Assessment is a certain percentage of the fair market value that is determined by local assessors to be the total taxable value of land and additions on the property. | Land | Improvement |
|---|---|---|---|---|
| 2024 | $2,839 | $87,560 | $22,642 | $64,918 |
| 2023 | $2,839 | $54,597 | $15,096 | $39,501 |
| 2022 | $1,893 | $54,596 | $15,095 | $39,501 |
| 2021 | $1,890 | $54,600 | $15,100 | $39,500 |
| 2020 | $1,711 | $47,520 | $10,940 | $36,580 |
| 2019 | $1,381 | $47,520 | $10,940 | $36,580 |
| 2018 | $1,379 | $47,520 | $10,940 | $36,580 |
| 2017 | $1,332 | $45,670 | $10,940 | $34,730 |
| 2016 | $1,335 | $45,670 | $10,940 | $34,730 |
| 2015 | $1,341 | $45,670 | $10,940 | $34,730 |
| 2014 | $738 | $50,330 | $10,940 | $39,390 |
| 2013 | $1,479 | $50,330 | $10,940 | $39,390 |
Source: Public Records
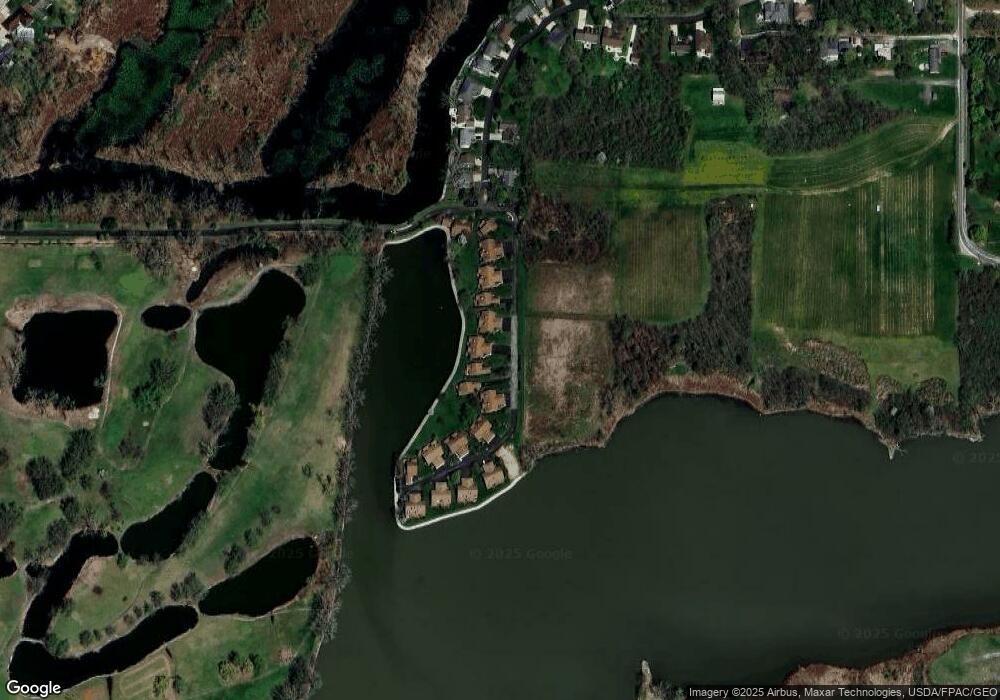
Map
Nearby Homes
- 146 N Harbors End Dr Unit 21A
- 3500 Woodhill Dr
- 2817 E Harbor Rd
- 2656 E Harbor Rd Unit D-3
- 2656 E Harbor Rd Unit D-1
- 2656 E Harbor Rd Unit D-2
- 3571 E Eagle Beach Cir
- 3638 E Rock Cliff Dr
- 3776 E Pine Dr
- 3720 E Aqua Aire Dr Unit 138
- 764 SE Catawba Rd Unit 115
- 764 SE Catawba Rd Unit 196
- 764 SE Catawba Rd Unit 109
- 764 SE Catawba Rd Unit 98
- 708 SE Catawba Rd Unit 2
- 708 SE Catawba Rd Unit 3
- 2350 E Sand Rd
- 2348 E Sand Rd
- 0 S Lightner Rd
- 1217 NE Catawba Rd
- 90 N Harbors End Dr
- 80 N Harbors End Dr Unit 16A
- 118 N Harbors End Dr
- 120 N Harbors End Dr Unit 19A
- 70 N Harbors End Dr Unit 15A
- 68 N Harbors End Dr
- 134 N Harbors End Dr
- 134 N Harbors End Dr Unit 20A
- 49 N Harbor Rd
- 60 N Harbors End Dr
- 60 N Harbors End Dr Unit 14A
- 144 N Harbors End Dr
- 58 N Harbors End Dr Unit 14B
- 54 N Harbors End Dr Unit 12B
- 56 N Harbors End Dr
- 56 N Harbors End Dr Unit 12A
- 154 N Harbors End Dr Unit 22B
- 156 N Harbors End Dr Unit 22A
- 59 N Harbors End Dr
- 2748 E Enchanted Lake Blvd