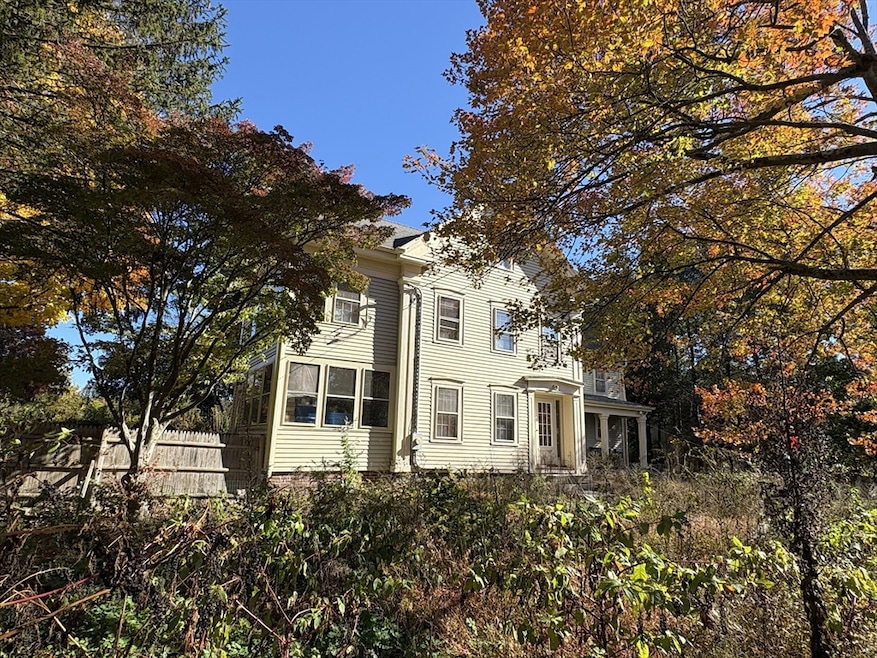
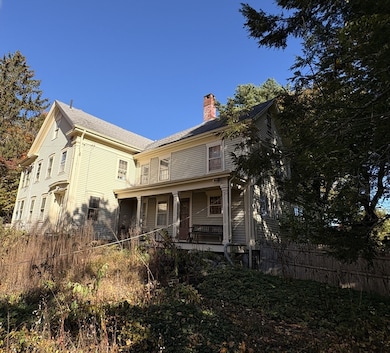
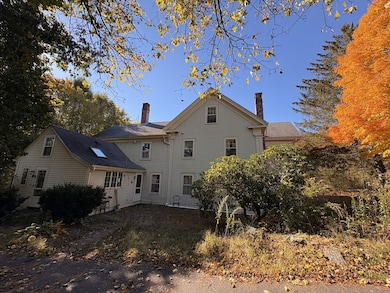
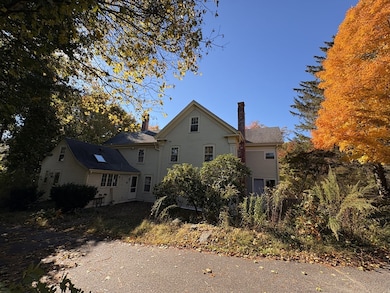
102 N Main St Sherborn, MA 01770
Estimated payment $4,905/month
Highlights
- Golf Course Community
- Community Stables
- Family Room with Fireplace
- Pine Hill Elementary School Rated A-
- Property is near public transit
- Antique Architecture
About This Home
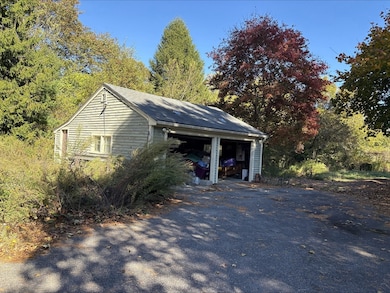
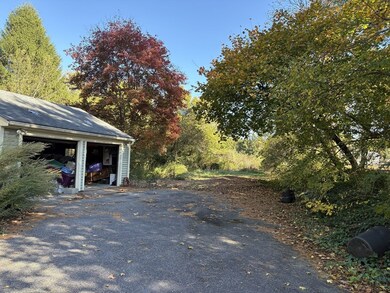
ATTENTION CONTRACTORS, FLIPPERS AND END USERS LOOKING FOR A PROJECT - THIS IS A SHORT SALE AND IN NEED OF A COMPLETE REHAB. This Antique Village Colonial is in the hub of Sherborn and will be truly amazing once fixed up. Its proximity to commuting routes, public transportation, Wellesley and Natick, make it an ideal location. The home has solid bones and offers 4 bedrooms, 2.5 baths and many original features including hardwood flooring throughout, 2 fireplaces, front and back staircases and a charming enclosed porch with beadboard ceiling. In addition there is a large 2 car detached garage. A wonderful opportunity for a buyer looking to create something special. Title V failed and Buyer to assume responsibility for the engineering and installation of a new septic...may not qualify for conventional financing. No open houses so schedule your private showing today.
Listing Agent
Berkshire Hathaway HomeServices Commonwealth Real Estate Listed on: 10/27/2025

Home Details
Home Type
- Single Family
Est. Annual Taxes
- $13,004
Year Built
- Built in 1854
Lot Details
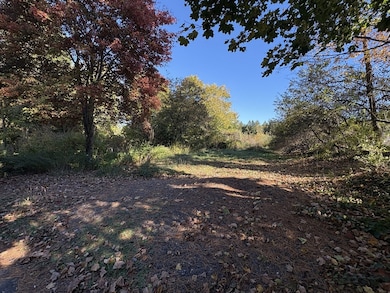
- 0.75 Acre Lot
- Level Lot
- Property is zoned RA
Parking
- 2 Car Detached Garage
Home Design
- Antique Architecture
- Stone Foundation
- Frame Construction
- Shingle Roof
Interior Spaces
- 2,428 Sq Ft Home
- Skylights
- Family Room with Fireplace
- 2 Fireplaces
- Living Room with Fireplace
- Den
- Wood Flooring
- Laundry on main level
- Unfinished Basement
Bedrooms and Bathrooms
- 4 Bedrooms
- Primary bedroom located on second floor
- Walk-In Closet
Outdoor Features
- Enclosed Patio or Porch
Location
- Property is near public transit
- Property is near schools
Schools
- Pine Hill Elementary School
- Dover Sherborn Middle School
- Dover Sherborn High School
Utilities
- No Cooling
- Heating System Uses Natural Gas
- Baseboard Heating
- Hot Water Heating System
- Private Water Source
- Gas Water Heater
- Private Sewer
Listing and Financial Details
- Assessor Parcel Number 742115
Community Details
Overview
- No Home Owners Association
- Near Conservation Area
Recreation
- Golf Course Community
- Tennis Courts
- Park
- Community Stables
Map
Home Values in the Area
Average Home Value in this Area
Tax History
| Year | Tax Paid | Tax Assessment Tax Assessment Total Assessment is a certain percentage of the fair market value that is determined by local assessors to be the total taxable value of land and additions on the property. | Land | Improvement |
|---|---|---|---|---|
| 2025 | $13,004 | $784,300 | $353,800 | $430,500 |
| 2024 | $12,168 | $717,900 | $289,100 | $428,800 |
| 2023 | $11,674 | $648,200 | $289,100 | $359,100 |
| 2022 | $11,192 | $588,100 | $289,100 | $299,000 |
| 2021 | $16,007 | $588,100 | $289,100 | $299,000 |
| 2020 | $11,145 | $572,700 | $289,100 | $283,600 |
| 2019 | $10,936 | $557,400 | $289,100 | $268,300 |
| 2018 | $10,758 | $557,400 | $289,100 | $268,300 |
| 2017 | $10,449 | $510,700 | $274,700 | $236,000 |
| 2016 | $10,505 | $510,700 | $274,700 | $236,000 |
| 2015 | $10,357 | $509,700 | $267,000 | $242,700 |
| 2014 | $9,875 | $485,500 | $250,600 | $234,900 |
Property History
| Date | Event | Price | List to Sale | Price per Sq Ft |
|---|---|---|---|---|
| 10/27/2025 10/27/25 | For Sale | $725,000 | -- | $299 / Sq Ft |
Purchase History
| Date | Type | Sale Price | Title Company |
|---|---|---|---|
| Deed | $285,000 | -- |
Mortgage History
| Date | Status | Loan Amount | Loan Type |
|---|---|---|---|
| Open | $395,000 | No Value Available | |
| Closed | $258,000 | No Value Available | |
| Closed | $256,500 | Purchase Money Mortgage |
Source: MLS Property Information Network (MLS PIN)
MLS Number: 73448212
APN: SHER-000010-000000-000066
Disclaimer: Certain information contained herein is derived from information provided by parties other than Homes.com. All information provided is deemed reliable, but is not guaranteed to be accurate and should be independently verified.
![]() The property listing data and information, or the Images, set forth herein were provided to MLS Property Information Network, Inc. from third party sources, including sellers, lessors and public records, and were compiled by MLS Property Information Network, Inc. The property listing data and information, and the Images, are for the personal, non-commercial use of consumers having a good faith interest in purchasing or leasing listed properties of the type displayed to them and may not be used for any purpose other than to identify prospective properties which such consumers may have a good faith interest in purchasing or leasing. MLS Property Information Network, Inc. and its subscribers disclaim any and all representations and warranties as to the accuracy of the property listing data and information, or as to the accuracy of any of the Images, set forth herein.
The property listing data and information, or the Images, set forth herein were provided to MLS Property Information Network, Inc. from third party sources, including sellers, lessors and public records, and were compiled by MLS Property Information Network, Inc. The property listing data and information, and the Images, are for the personal, non-commercial use of consumers having a good faith interest in purchasing or leasing listed properties of the type displayed to them and may not be used for any purpose other than to identify prospective properties which such consumers may have a good faith interest in purchasing or leasing. MLS Property Information Network, Inc. and its subscribers disclaim any and all representations and warranties as to the accuracy of the property listing data and information, or as to the accuracy of any of the Images, set forth herein.
- 105 N Main St
- 221 Pond St
- 5 Autumn Ln
- 26 Walden Dr Unit 7
- 34 Walden Dr Unit 3
- 5 Thoreau Ct Unit 21
- 6 Post Oak Ln Unit 10
- 42 Silver Hill Ln Unit 4
- 38 Silver Hill Ln Unit 8
- 16 Page Farm Rd
- 3 Circular Ave
- 20 Woodbine Rd
- 19 Village Hill Ln Unit 3
- 78 W Central St Unit 2
- 17 Weld St Unit 32
- 10 High St Unit 2
- 31 Pearl St Unit 2
- 77 W Central St
- 79 W Central St Unit 2
- 11 Village Hill Ln Unit 1