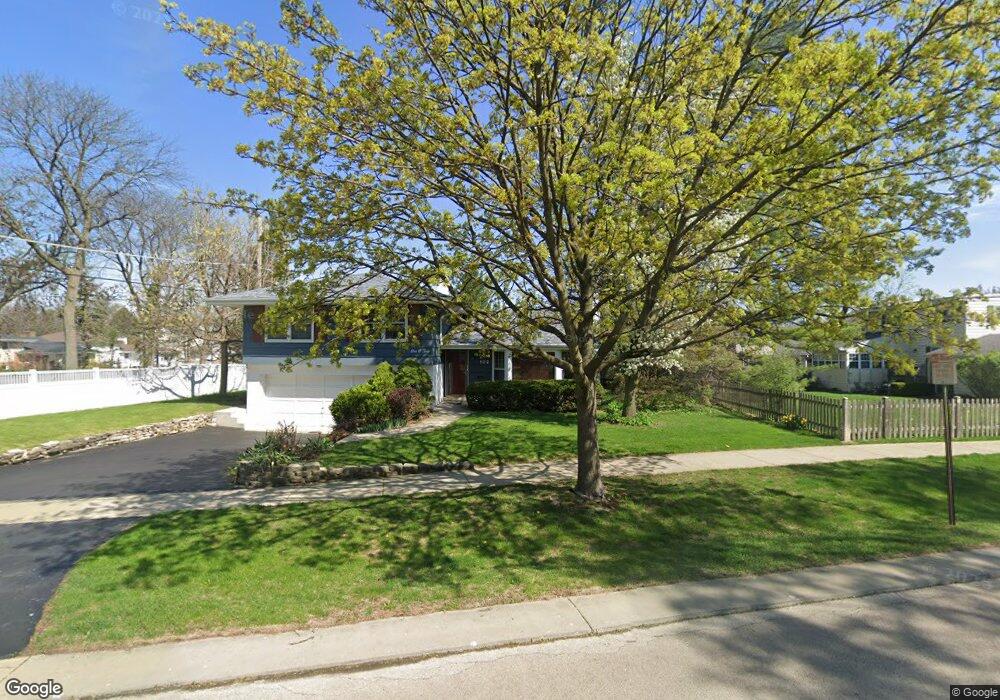
102 Naperville Rd Clarendon Hills, IL 60514
Estimated Value: $641,000 - $816,000
4
Beds
2
Baths
1,826
Sq Ft
$390/Sq Ft
Est. Value
About This Home
This home is located at 102 Naperville Rd, Clarendon Hills, IL 60514 and is currently estimated at $712,802, approximately $390 per square foot. 102 Naperville Rd is a home located in DuPage County with nearby schools including Prospect Elementary School, Clarendon Hills Middle School, and Hinsdale Central High School.
Ownership History
Date
Name
Owned For
Owner Type
Purchase Details
Closed on
Aug 20, 2007
Sold by
Reimann Maureen M and The Maureen M Reimann Revocabl
Bought by
Ding Hong and Lin Jueli
Current Estimated Value
Home Financials for this Owner
Home Financials are based on the most recent Mortgage that was taken out on this home.
Original Mortgage
$300,000
Outstanding Balance
$183,439
Interest Rate
6%
Mortgage Type
Purchase Money Mortgage
Estimated Equity
$529,363
Purchase Details
Closed on
Jan 21, 1998
Sold by
Reimann Paul and Reimann Maureen
Bought by
Reimann Maureen M and Maureen M Reimann Revocable Tr
Create a Home Valuation Report for This Property
The Home Valuation Report is an in-depth analysis detailing your home's value as well as a comparison with similar homes in the area
Home Values in the Area
Average Home Value in this Area
Purchase History
| Date | Buyer | Sale Price | Title Company |
|---|---|---|---|
| Ding Hong | $470,000 | Ctic Dupage | |
| Reimann Maureen M | -- | -- |
Source: Public Records
Mortgage History
| Date | Status | Borrower | Loan Amount |
|---|---|---|---|
| Open | Ding Hong | $300,000 |
Source: Public Records
Tax History Compared to Growth
Tax History
| Year | Tax Paid | Tax Assessment Tax Assessment Total Assessment is a certain percentage of the fair market value that is determined by local assessors to be the total taxable value of land and additions on the property. | Land | Improvement |
|---|---|---|---|---|
| 2024 | -- | $206,301 | $91,658 | $114,643 |
| 2023 | $11,112 | $189,650 | $84,260 | $105,390 |
| 2022 | $10,812 | $185,750 | $82,530 | $103,220 |
| 2021 | $10,457 | $183,640 | $81,590 | $102,050 |
| 2020 | $10,261 | $180,000 | $79,970 | $100,030 |
| 2019 | $10,207 | $172,710 | $76,730 | $95,980 |
| 2018 | $9,310 | $163,580 | $76,260 | $87,320 |
| 2017 | $8,370 | $146,450 | $73,380 | $73,070 |
| 2016 | $7,503 | $128,150 | $70,030 | $58,120 |
| 2015 | $7,426 | $120,570 | $65,890 | $54,680 |
| 2014 | $7,184 | $112,390 | $64,060 | $48,330 |
| 2013 | $6,851 | $111,860 | $63,760 | $48,100 |
Source: Public Records
Map
Nearby Homes
- 632 Independence Ave
- 140 N Quincy St
- 147 Chicago Ave
- 6 Pine Hill Ln
- 509 Citadel Cir Unit 4
- 141 Breakenridge Farm
- 531 Bonnie Brae Rd
- 410 Chicago Ave
- 104 S Monroe St
- 562 Revere Ave
- 523 Hamilton Ave
- 45 S Thurlow St
- 210 W Hickory St
- 309 E Naperville Rd
- 512 Blackhawk Dr
- 322 Park Ave Unit 2A
- 3 Templeton Dr
- 401 Glendale Ave
- 443 S Clay St
- 45 Tartan Lakes Dr