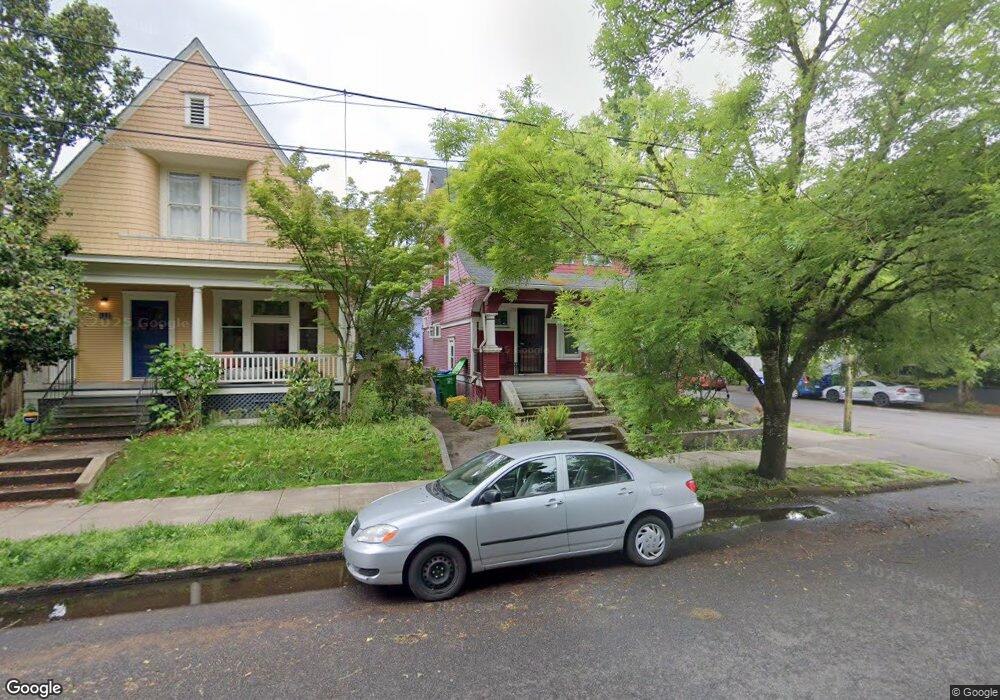
102 NE Monroe St Portland, OR 97212
Estimated Value: $522,000 - $597,000
3
Beds
1
Bath
2,139
Sq Ft
$259/Sq Ft
Est. Value
About This Home
This home is located at 102 NE Monroe St, Portland, OR 97212 and is currently estimated at $554,691, approximately $259 per square foot. 102 NE Monroe St is a home located in Multnomah County with nearby schools including Boise-Eliot Elementary School, Harriet Tubman Middle School, and Jefferson High School.
Ownership History
Date
Name
Owned For
Owner Type
Purchase Details
Closed on
Oct 23, 2015
Sold by
Zelada Armando Jerry
Bought by
Zelada Armando Jerry and Armando Jerry Zelada Trust
Current Estimated Value
Purchase Details
Closed on
Mar 2, 2011
Sold by
Zelada A J
Bought by
Zelada Armando Jerry
Home Financials for this Owner
Home Financials are based on the most recent Mortgage that was taken out on this home.
Original Mortgage
$128,500
Outstanding Balance
$87,959
Interest Rate
4.71%
Mortgage Type
New Conventional
Estimated Equity
$466,732
Purchase Details
Closed on
Dec 19, 2002
Sold by
Flectcher Earl J
Bought by
Zelada A J
Home Financials for this Owner
Home Financials are based on the most recent Mortgage that was taken out on this home.
Original Mortgage
$141,600
Interest Rate
6.03%
Mortgage Type
Purchase Money Mortgage
Purchase Details
Closed on
Aug 5, 1999
Sold by
Fletcher Earl J
Bought by
Fletcher Earl J
Create a Home Valuation Report for This Property
The Home Valuation Report is an in-depth analysis detailing your home's value as well as a comparison with similar homes in the area
Home Values in the Area
Average Home Value in this Area
Purchase History
| Date | Buyer | Sale Price | Title Company |
|---|---|---|---|
| Zelada Armando Jerry | -- | None Available | |
| Zelada Armando Jerry | -- | Fidelity Natl Title Co Of Or | |
| Zelada A J | $177,000 | Pacific Nw Title | |
| Fletcher Earl J | -- | Oregon Title Insurance Co |
Source: Public Records
Mortgage History
| Date | Status | Borrower | Loan Amount |
|---|---|---|---|
| Open | Zelada Armando Jerry | $128,500 | |
| Closed | Zelada A J | $141,600 |
Source: Public Records
Tax History Compared to Growth
Tax History
| Year | Tax Paid | Tax Assessment Tax Assessment Total Assessment is a certain percentage of the fair market value that is determined by local assessors to be the total taxable value of land and additions on the property. | Land | Improvement |
|---|---|---|---|---|
| 2024 | $3,551 | $132,730 | -- | -- |
| 2023 | $3,415 | $128,870 | $0 | $0 |
| 2022 | $3,341 | $125,120 | $0 | $0 |
| 2021 | $3,285 | $121,480 | $0 | $0 |
| 2020 | $3,013 | $117,950 | $0 | $0 |
| 2019 | $2,903 | $114,520 | $0 | $0 |
| 2018 | $2,817 | $111,190 | $0 | $0 |
| 2017 | $2,700 | $107,960 | $0 | $0 |
| 2016 | $2,471 | $104,820 | $0 | $0 |
| 2015 | $2,407 | $101,770 | $0 | $0 |
| 2014 | $2,370 | $98,810 | $0 | $0 |
Source: Public Records
Map
Nearby Homes
- 3133 NE Rodney Ave
- 205 NE Stanton St
- 35 NE Morris St
- 2845 NE Martin Luther King Junior Blvd
- 325 NE Graham St Unit 8
- 78 NE Ivy St
- 533 NE Fargo St
- 0 NE Mlk and Fremont Blvd Unit 23325427
- 12 NE Fremont St Unit 3W
- 12 NE Fremont St Unit 3E
- 236 NE Knott St
- 3550 NE Garfield Ave Unit 1
- 3552 NE Garfield Ave Unit 2
- 3554 NE Garfield Ave Unit 3
- 3558 NE Garfield Ave Unit 5
- 3562 NE Garfield Ave Unit 7
- 3564 NE Garfield Ave
- 3512 NE Grand Ave
- 2741 NE 7th Ave
- 2639 NE 6th Place
- 110 NE Monroe St
- 3026 NE Rodney Ave
- 118 NE Monroe St
- 0 NE Rodney Ave
- 3020 NE Rodney Ave
- 88 NE Monroe St
- 126 NE Monroe St
- 3033 NE Rodney Ave
- 101 NE Monroe St
- 103 NE Morris St
- 78 NE Monroe St
- 119 NE Monroe St
- 132 NE Monroe St
- 119 NE Morris St
- 127 NE Morris St
- 127 NE Monroe St
- 87 NE Morris St
- 3107 NE Rodney Ave
- 201 NE Morris St
- 72 NE Monroe St