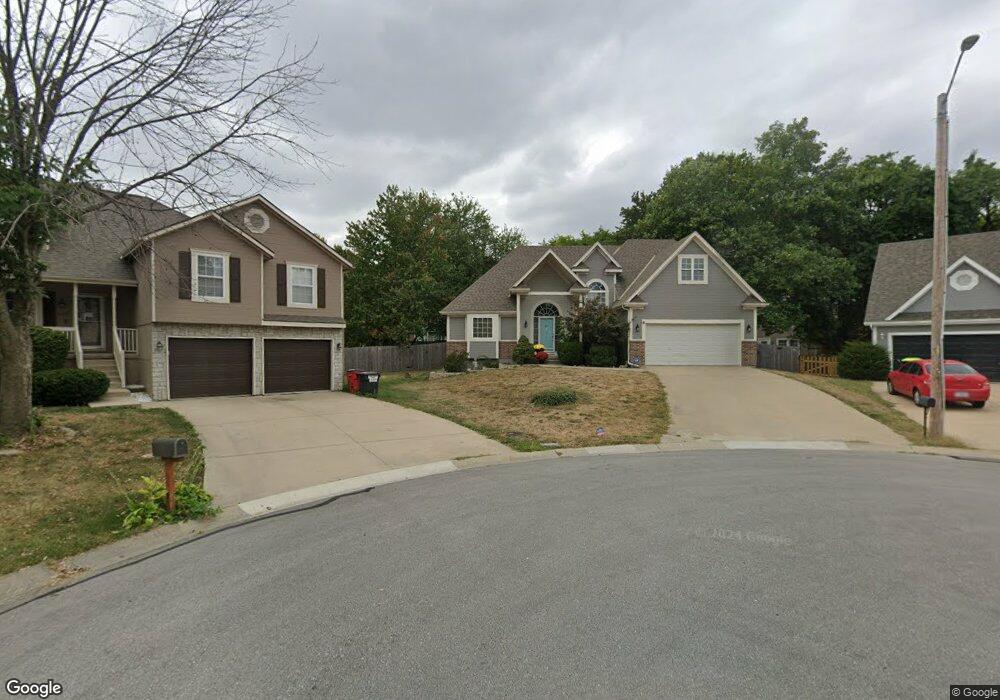
102 NE Red Bridge Ct Blue Springs, MO 64014
Estimated Value: $311,000 - $375,000
3
Beds
3
Baths
1,774
Sq Ft
$195/Sq Ft
Est. Value
About This Home
This home is located at 102 NE Red Bridge Ct, Blue Springs, MO 64014 and is currently estimated at $345,547, approximately $194 per square foot. 102 NE Red Bridge Ct is a home located in Jackson County with nearby schools including Lucy Franklin Elementary School, Brittany Hill Middle School, and Blue Springs High School.
Ownership History
Date
Name
Owned For
Owner Type
Purchase Details
Closed on
Dec 21, 2007
Sold by
Paschal Susanna and Smoot Susanna
Bought by
Paschal Susanna
Current Estimated Value
Home Financials for this Owner
Home Financials are based on the most recent Mortgage that was taken out on this home.
Original Mortgage
$162,000
Outstanding Balance
$102,327
Interest Rate
6.26%
Mortgage Type
Stand Alone Refi Refinance Of Original Loan
Estimated Equity
$243,220
Purchase Details
Closed on
Jul 26, 2004
Sold by
Roane Richard D and Roane Melanie
Bought by
Smoot Susanna
Home Financials for this Owner
Home Financials are based on the most recent Mortgage that was taken out on this home.
Original Mortgage
$168,000
Interest Rate
6.3%
Mortgage Type
Purchase Money Mortgage
Purchase Details
Closed on
Feb 5, 2004
Sold by
Revocabl Scott Stacey Kathleen
Bought by
Roane Richard D and Roane Melanie
Purchase Details
Closed on
Jan 22, 2002
Sold by
Davidson Jeremy S and Davidson Suzanne B
Bought by
Scott Stacey Kathleen
Create a Home Valuation Report for This Property
The Home Valuation Report is an in-depth analysis detailing your home's value as well as a comparison with similar homes in the area
Home Values in the Area
Average Home Value in this Area
Purchase History
| Date | Buyer | Sale Price | Title Company |
|---|---|---|---|
| Paschal Susanna | -- | None Available | |
| Smoot Susanna | -- | -- | |
| Roane Richard D | -- | Old Republic Title Company O | |
| Scott Stacey Kathleen | -- | Security Land Title Company |
Source: Public Records
Mortgage History
| Date | Status | Borrower | Loan Amount |
|---|---|---|---|
| Open | Paschal Susanna | $162,000 | |
| Closed | Smoot Susanna | $168,000 |
Source: Public Records
Tax History Compared to Growth
Tax History
| Year | Tax Paid | Tax Assessment Tax Assessment Total Assessment is a certain percentage of the fair market value that is determined by local assessors to be the total taxable value of land and additions on the property. | Land | Improvement |
|---|---|---|---|---|
| 2025 | $3,841 | $49,974 | $6,717 | $43,257 |
| 2024 | $3,841 | $47,086 | $6,734 | $40,352 |
| 2023 | $3,768 | $47,086 | $5,922 | $41,164 |
| 2022 | $3,905 | $43,130 | $5,327 | $37,803 |
| 2021 | $3,901 | $43,130 | $5,327 | $37,803 |
| 2020 | $3,585 | $40,307 | $5,327 | $34,980 |
| 2019 | $3,465 | $40,307 | $5,327 | $34,980 |
| 2018 | $3,133 | $35,080 | $4,636 | $30,444 |
| 2017 | $3,133 | $35,080 | $4,636 | $30,444 |
| 2016 | $2,950 | $33,117 | $5,320 | $27,797 |
| 2014 | $2,864 | $32,042 | $5,309 | $26,733 |
Source: Public Records
Map
Nearby Homes
- 1912 NW Manor Dr
- 280 NW Beau Dr
- 204 NW Golfview Dr
- 311 NE Bridge Place
- 404 NE Lee Dr
- 1914 NE Grant Cir
- 105 NE Leann Dr
- 2105 NW 5th St
- 516 NW Brett Cir
- 420 NE Golfview Dr
- 2400 NW 1st St
- 2323 NW Acorn Dr
- 517 NE Johnston Dr
- 2012 NE Adams Dairy Rd
- 1200 NE Hilltop Dr
- 1200 NE Crestview Dr
- 816 NE Mary Ct
- 409 NW Locust Dr
- 2515 NE Springbrook St
- 0 NW Jefferson St
- 103 NE Red Bridge Ct
- 106 NE Red Bridge Ct
- 110 NE Red Bridge Ct
- 107 NE Red Bridge Ct
- 1860 NW 2nd St
- 1880 NW 2nd St
- 111 NE Red Bridge Ct
- 114 NE Red Bridge Ct
- 1840 NW 2nd St
- 1900 NW 2nd St
- 105 NE Stonebridge Ct
- 101 NE Stonebridge Ct
- 104 NE Madison Ct
- 109 NE Stonebridge Ct
- 1830 NW 2nd St
- 1920 NW 2nd St
- 113 NE Stonebridge Ct
- 108 NE Madison Ct
- 100 NE Stonebridge Ct
- 1815 NE 2nd St