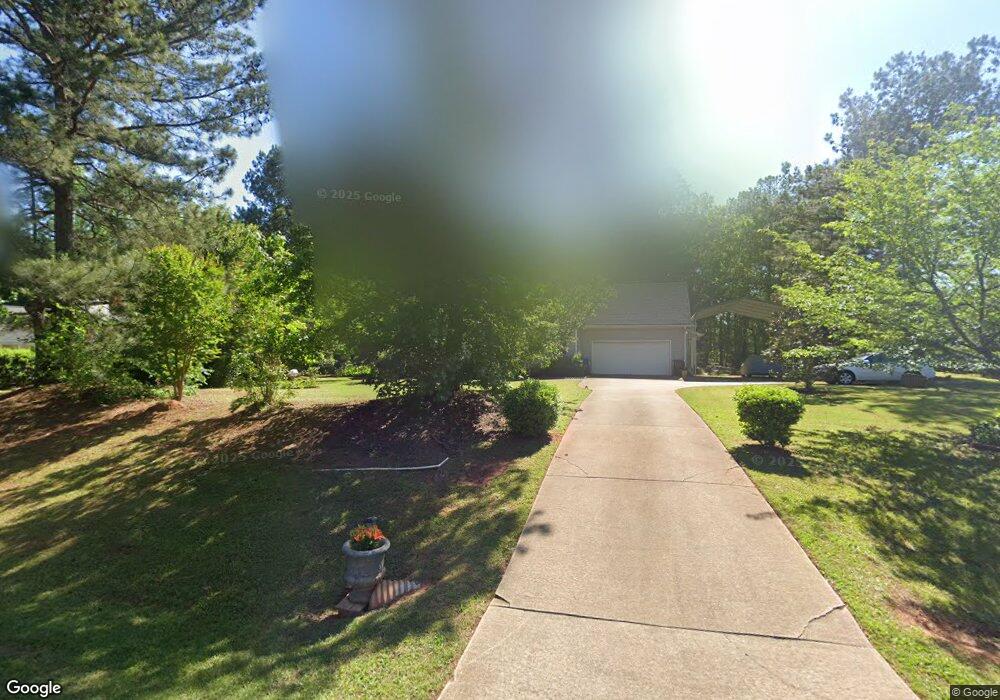
102 Neagle Rd Unit 3 Jackson, GA 30233
Southwest Butts NeighborhoodEstimated Value: $260,000 - $348,000
--
Bed
2
Baths
2,460
Sq Ft
$125/Sq Ft
Est. Value
About This Home
This home is located at 102 Neagle Rd Unit 3, Jackson, GA 30233 and is currently estimated at $307,087, approximately $124 per square foot. 102 Neagle Rd Unit 3 is a home located in Butts County with nearby schools including Jackson High School.
Ownership History
Date
Name
Owned For
Owner Type
Purchase Details
Closed on
Aug 29, 2022
Sold by
Chandler Sherry C
Bought by
Ranstrom Henry O and Chandler Sherry C
Current Estimated Value
Purchase Details
Closed on
Dec 15, 2020
Sold by
Ranstrom Henry O
Bought by
Ranstrom Henry O and Chandler Sherry C
Create a Home Valuation Report for This Property
The Home Valuation Report is an in-depth analysis detailing your home's value as well as a comparison with similar homes in the area
Home Values in the Area
Average Home Value in this Area
Purchase History
| Date | Buyer | Sale Price | Title Company |
|---|---|---|---|
| Ranstrom Henry O | -- | -- | |
| Ranstrom Henry O | $150,000 | -- |
Source: Public Records
Tax History Compared to Growth
Tax History
| Year | Tax Paid | Tax Assessment Tax Assessment Total Assessment is a certain percentage of the fair market value that is determined by local assessors to be the total taxable value of land and additions on the property. | Land | Improvement |
|---|---|---|---|---|
| 2024 | $2,646 | $124,816 | $13,800 | $111,016 |
| 2023 | $2,776 | $109,388 | $13,800 | $95,588 |
| 2022 | $2,150 | $79,242 | $13,800 | $65,442 |
| 2021 | $2,133 | $73,421 | $13,800 | $59,621 |
| 2020 | $1,919 | $73,421 | $13,800 | $59,621 |
| 2019 | $1,447 | $59,639 | $13,800 | $45,839 |
| 2018 | $1,412 | $56,640 | $13,800 | $42,840 |
| 2017 | $1,287 | $51,861 | $8,800 | $43,061 |
| 2016 | $1,322 | $51,861 | $8,800 | $43,061 |
| 2015 | $1,286 | $51,861 | $8,800 | $43,061 |
| 2014 | $1,289 | $49,024 | $8,800 | $40,224 |
Source: Public Records
Map
Nearby Homes
- 138 Lewis Rd
- 539 Levi Barnes Rd
- 2182 High Falls Rd
- 162 Feather Ln
- 0 Dean Patrick Rd Unit 10453817
- 604 Dean Patrick Rd
- 2040 Ga-16
- 6018 Jackson Rd
- 6014 Jackson Rd
- 209 Windy Ln
- 0 Harkness Rd Unit 10628667
- 240 Harkness Rd
- 228 Indian Creek Rd
- 113 Truman Ct
- 112 Truman Ct
- 245 Brooks Rd
- 610 Dean Patrick Rd
- 667 Jenkinsburg Rd
- 150 Dub Walker Rd
- 3036 High Falls Rd
- 106 Neagle Rd
- 108 Whippoorwill Ridge Rd
- 103 Glavine St
- 110 Neagle Rd Unit 5
- 114 Whippoorwill Ridge Rd
- 107 Whippoorwill Ridge Rd
- 107 Neagle Rd
- 107 Glavine St
- 102 Whippoorwill Ridge Rd
- 114 Neagle Rd
- 120 Whippoorwill Ridge Rd
- 111 Neagle Rd
- 106 Glavine St Unit 16
- 104 Whippoorwill Ridge Rd
- 111 Glavine St
- 115 Neagle Rd Unit 9
- 119 Whippoorwill Ridge Rd
- 118 Neagle Rd Unit 7
- 232 Joe Lane Rd
- 110 Glavine St