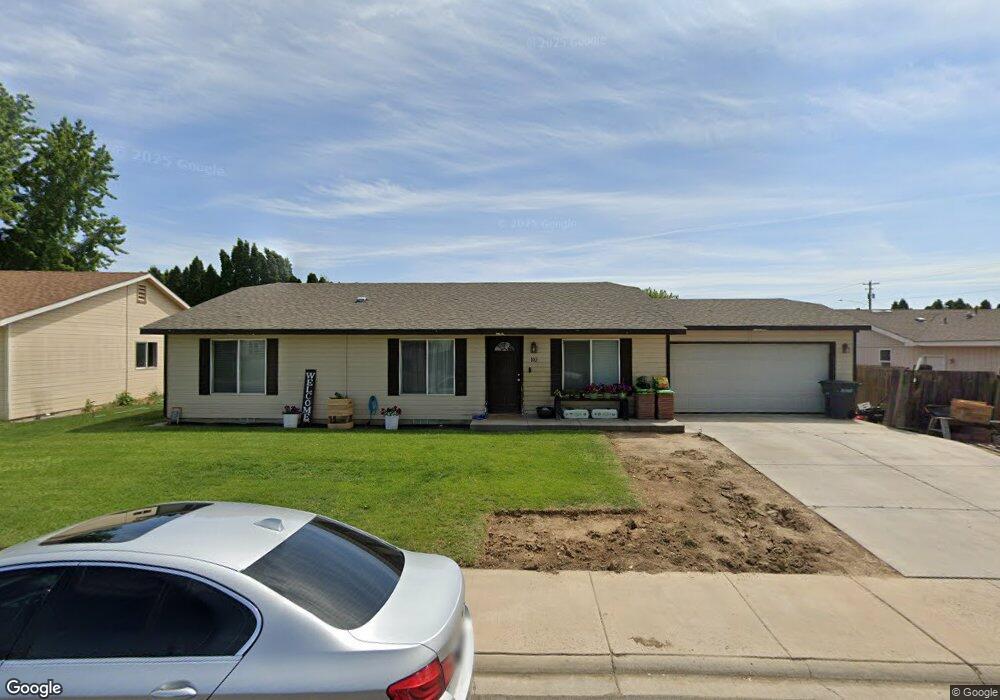
102 Northstone Pkwy Zillah, WA 98953
Estimated Value: $369,000 - $417,000
3
Beds
2
Baths
1,256
Sq Ft
$308/Sq Ft
Est. Value
About This Home
This home is located at 102 Northstone Pkwy, Zillah, WA 98953 and is currently estimated at $387,419, approximately $308 per square foot. 102 Northstone Pkwy is a home located in Yakima County with nearby schools including Hilton Elementary School, Zillah Intermediate School, and Zillah Middle School.
Ownership History
Date
Name
Owned For
Owner Type
Purchase Details
Closed on
Jul 28, 2009
Sold by
Clark Kenneth A and Clark Roxanne
Bought by
Gallegos Michael
Current Estimated Value
Home Financials for this Owner
Home Financials are based on the most recent Mortgage that was taken out on this home.
Original Mortgage
$143,355
Outstanding Balance
$93,944
Interest Rate
5.31%
Mortgage Type
FHA
Estimated Equity
$293,475
Purchase Details
Closed on
Dec 29, 2003
Sold by
United Builders Of Washington Inc
Bought by
Clark Kenneth A
Home Financials for this Owner
Home Financials are based on the most recent Mortgage that was taken out on this home.
Original Mortgage
$123,000
Interest Rate
6.03%
Mortgage Type
Purchase Money Mortgage
Purchase Details
Closed on
Sep 9, 2003
Sold by
Smith Alyce A and Ross Alyce A
Bought by
United Builders Of Washington Inc
Create a Home Valuation Report for This Property
The Home Valuation Report is an in-depth analysis detailing your home's value as well as a comparison with similar homes in the area
Home Values in the Area
Average Home Value in this Area
Purchase History
| Date | Buyer | Sale Price | Title Company |
|---|---|---|---|
| Gallegos Michael | $146,000 | Valley Title Company | |
| Clark Kenneth A | $129,693 | Valley Title Company | |
| United Builders Of Washington Inc | $23,500 | Valley Title Company |
Source: Public Records
Mortgage History
| Date | Status | Borrower | Loan Amount |
|---|---|---|---|
| Open | Gallegos Michael | $143,355 | |
| Previous Owner | Clark Kenneth A | $123,000 |
Source: Public Records
Tax History Compared to Growth
Tax History
| Year | Tax Paid | Tax Assessment Tax Assessment Total Assessment is a certain percentage of the fair market value that is determined by local assessors to be the total taxable value of land and additions on the property. | Land | Improvement |
|---|---|---|---|---|
| 2025 | $2,856 | $324,100 | $33,900 | $290,200 |
| 2023 | $3,148 | $316,300 | $47,200 | $269,100 |
| 2022 | $2,786 | $239,000 | $53,900 | $185,100 |
| 2021 | $2,660 | $215,500 | $48,500 | $167,000 |
| 2019 | $2,345 | $197,400 | $44,400 | $153,000 |
| 2018 | $2,236 | $169,600 | $40,200 | $129,400 |
| 2017 | $1,750 | $158,800 | $40,200 | $118,600 |
| 2016 | $1,694 | $157,150 | $40,250 | $116,900 |
| 2015 | $1,694 | $147,850 | $40,250 | $107,600 |
| 2014 | $1,694 | $147,600 | $40,000 | $107,600 |
| 2013 | $1,694 | $147,600 | $40,000 | $107,600 |
Source: Public Records
Map
Nearby Homes
- 270 Cheyne Rd
- 0 Cheyne Rd
- 11 3rd Ave
- 221 4th Ave
- 410 Baker Dr
- 635 Westwind Dr
- 1007 Vintage Valley Pkwy
- 10892 Yakima Valley Hwy
- NKA Buena Rd
- 1111 Roza Dr
- 600 Schooley Rd
- 501 N 8th St
- 811 2nd Ave Unit 24
- 811 2nd Ave Unit 7
- 714 W Third St Unit 35
- 202 Pearson St
- 202 Ann St
- 1502 Kagley Way
- 8019 Vialago Pkwy
- 801 Fountain Blvd
- 100 Northstone Pkwy
- 104 Northstone Pkwy
- LOT 3 Northstone Pkwy
- 271 Cheyne Rd
- LOT 23 Northstone Pkwy
- 140 Northstone Pkwy
- 105 Northstone Pkwy
- LOT 22 Northstone Pkwy
- 241 Cheyne Rd
- 138 Northstone Pkwy
- LOT 6 Northstone Pkwy
- 107 Northstone Pkwy
- 136 Northstone Pkwy
- 108 Northstone Pkwy
- 109 Northstone Pkwy
- 133 Northstone Pkwy
- 1450 Cutler Way
- 134 Northstone Pkwy
- 111 Northstone Pkwy