Estimated Value: $150,000 - $190,355
3
Beds
1
Bath
1,440
Sq Ft
$118/Sq Ft
Est. Value
About This Home
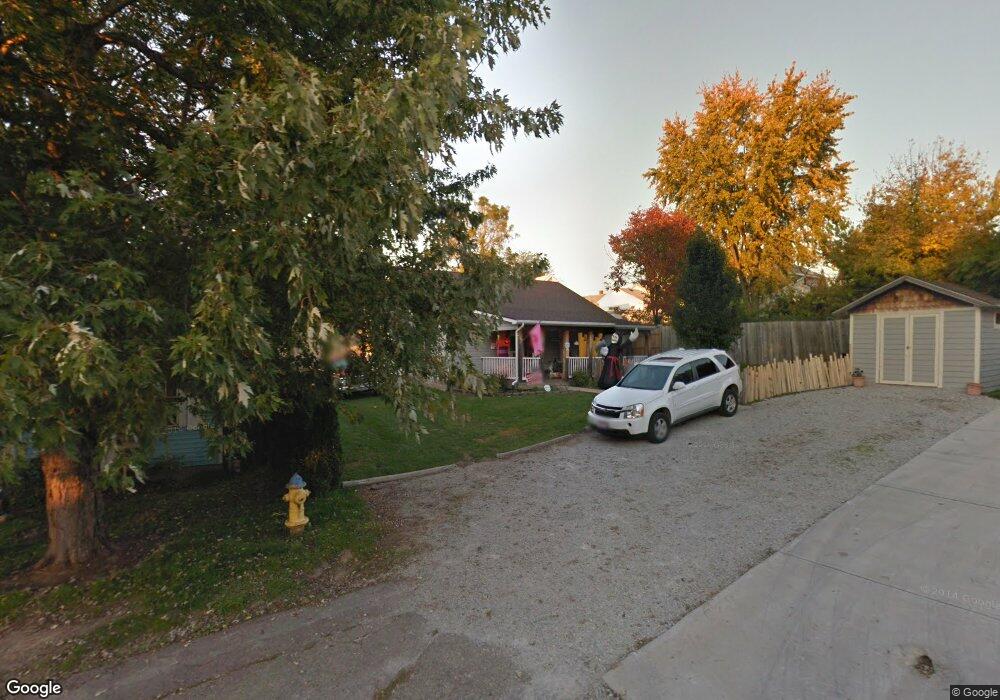
This home is located at 102 Owens Ave, Xenia, OH 45385 and is currently estimated at $169,339, approximately $117 per square foot. 102 Owens Ave is a home located in Greene County with nearby schools including Xenia High School, Summit Academy Community School for Alternative Learners - Xenia, and Legacy Christian Academy.
Ownership History
Date
Name
Owned For
Owner Type
Purchase Details
Closed on
May 10, 2005
Sold by
Bennett Roger D
Bought by
Jones Robert J and Mccool Martha S
Current Estimated Value
Home Financials for this Owner
Home Financials are based on the most recent Mortgage that was taken out on this home.
Original Mortgage
$80,100
Outstanding Balance
$42,327
Interest Rate
6.05%
Mortgage Type
Fannie Mae Freddie Mac
Estimated Equity
$127,012
Purchase Details
Closed on
Sep 8, 1994
Sold by
Moore Eula B
Bought by
Smith Frederick W and Smith L
Create a Home Valuation Report for This Property
The Home Valuation Report is an in-depth analysis detailing your home's value as well as a comparison with similar homes in the area
Home Values in the Area
Average Home Value in this Area
Purchase History
| Date | Buyer | Sale Price | Title Company |
|---|---|---|---|
| Jones Robert J | $89,000 | -- | |
| Smith Frederick W | $2,500 | -- |
Source: Public Records
Mortgage History
| Date | Status | Borrower | Loan Amount |
|---|---|---|---|
| Open | Jones Robert J | $80,100 |
Source: Public Records
Tax History Compared to Growth
Tax History
| Year | Tax Paid | Tax Assessment Tax Assessment Total Assessment is a certain percentage of the fair market value that is determined by local assessors to be the total taxable value of land and additions on the property. | Land | Improvement |
|---|---|---|---|---|
| 2024 | $1,778 | $42,640 | $5,960 | $36,680 |
| 2023 | $1,778 | $42,640 | $5,960 | $36,680 |
| 2022 | $1,562 | $31,940 | $4,770 | $27,170 |
| 2021 | $1,583 | $31,940 | $4,770 | $27,170 |
| 2020 | $1,515 | $31,940 | $4,770 | $27,170 |
| 2019 | $1,626 | $32,270 | $5,230 | $27,040 |
| 2018 | $1,633 | $32,270 | $5,230 | $27,040 |
| 2017 | $1,557 | $32,270 | $5,230 | $27,040 |
| 2016 | $1,558 | $30,230 | $5,230 | $25,000 |
| 2015 | $1,562 | $30,230 | $5,230 | $25,000 |
| 2014 | $1,494 | $30,230 | $5,230 | $25,000 |
Source: Public Records
Map
Nearby Homes