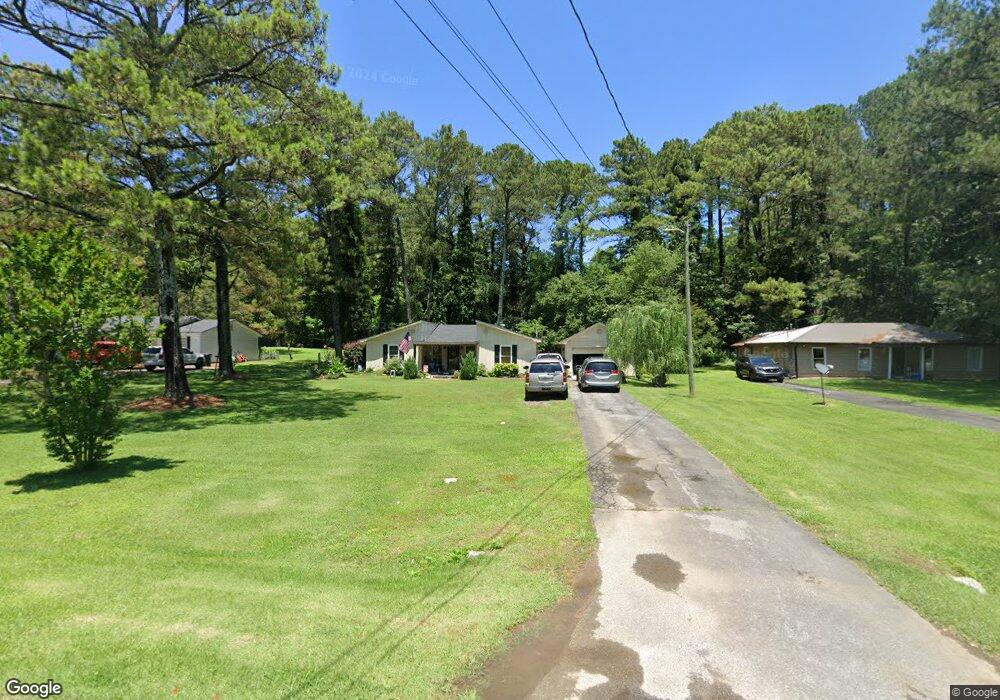
102 Oxford Dr Calhoun, GA 30701
Estimated Value: $194,000 - $218,000
3
Beds
1
Bath
1,260
Sq Ft
$163/Sq Ft
Est. Value
About This Home
This home is located at 102 Oxford Dr, Calhoun, GA 30701 and is currently estimated at $205,075, approximately $162 per square foot. 102 Oxford Dr is a home located in Gordon County with nearby schools including Calhoun Primary School, Calhoun Elementary School, and Calhoun Middle School.
Ownership History
Date
Name
Owned For
Owner Type
Purchase Details
Closed on
Apr 30, 2018
Sold by
Bentley Jeffery Lance Trus
Bought by
Belk Carl and Belk Paula
Current Estimated Value
Home Financials for this Owner
Home Financials are based on the most recent Mortgage that was taken out on this home.
Original Mortgage
$90,909
Outstanding Balance
$78,348
Interest Rate
4.44%
Mortgage Type
New Conventional
Estimated Equity
$126,727
Purchase Details
Closed on
Aug 26, 2016
Sold by
Jeffrey Lance /Tr
Bought by
Bentley Lance
Home Financials for this Owner
Home Financials are based on the most recent Mortgage that was taken out on this home.
Original Mortgage
$63,750
Interest Rate
3.48%
Mortgage Type
New Conventional
Purchase Details
Closed on
Mar 22, 2016
Sold by
Bentley Lance
Bought by
Bentley Jeffrey Lance
Purchase Details
Closed on
Jan 12, 2004
Sold by
Davis Muril Travis and Joyce Denise
Bought by
Bentley Lance
Create a Home Valuation Report for This Property
The Home Valuation Report is an in-depth analysis detailing your home's value as well as a comparison with similar homes in the area
Home Values in the Area
Average Home Value in this Area
Purchase History
| Date | Buyer | Sale Price | Title Company |
|---|---|---|---|
| Belk Carl | $90,000 | -- | |
| Bentley Lance | -- | -- | |
| Bentley Jeffrey Lance | -- | -- | |
| Bentley Lance | $92,500 | -- |
Source: Public Records
Mortgage History
| Date | Status | Borrower | Loan Amount |
|---|---|---|---|
| Open | Belk Carl | $90,909 | |
| Previous Owner | Bentley Lance | $63,750 |
Source: Public Records
Tax History Compared to Growth
Tax History
| Year | Tax Paid | Tax Assessment Tax Assessment Total Assessment is a certain percentage of the fair market value that is determined by local assessors to be the total taxable value of land and additions on the property. | Land | Improvement |
|---|---|---|---|---|
| 2024 | $1,253 | $44,552 | $4,200 | $40,352 |
| 2023 | $1,175 | $41,796 | $4,200 | $37,596 |
| 2022 | $375 | $39,440 | $4,200 | $35,240 |
| 2021 | $977 | $32,808 | $4,200 | $28,608 |
| 2020 | $993 | $33,096 | $4,200 | $28,896 |
| 2019 | $992 | $33,096 | $4,200 | $28,896 |
| 2018 | $301 | $31,224 | $4,200 | $27,024 |
| 2017 | $291 | $29,584 | $4,200 | $25,384 |
| 2016 | $272 | $29,584 | $4,200 | $25,384 |
| 2015 | $270 | $29,024 | $4,200 | $24,824 |
| 2014 | $253 | $27,660 | $4,200 | $23,460 |
Source: Public Records
Map
Nearby Homes
- 119 Deer Park Ln
- 199 Cherry St SE
- 102 Sylvania Cir
- 306 E Belmont Dr
- 200 Wildwood Cir SE
- 402 Linda Ln
- 111 Lewis Dr SE
- 117 Lavender Cir
- 103 Lavender Cir
- 107 Lavender Cir
- 119 Lavender Cir
- 116 Lavender Cir
- 110 Lavender Cir
- 114 Lavender Cir
- 118 Lavender Cir
- 62 Professional Place Unit 30
- The Kora Plan at Salacoa - Wildflower
- The Violet Plan at Salacoa - Wildflower
- The Madison Plan at Salacoa - Wildflower
- The Lavender Plan at Salacoa - Rosewood
- 100 Oxford Dr
- 104 Oxford Dr
- 106 Oxford Dr
- 0 Oxford Dr Unit 8427910
- 0 Oxford Dr
- 101 Oxford Dr
- 105 Sylvan Dr
- 407 Woodland Terrace
- 108 Oxford Dr
- 101 Sylvan Dr
- 105 Oxford Dr
- 145 Pineview Way
- 404 Woodland Terrace
- 505 Woodland Terrace
- 144 Pineview Way
- 107 Oxford Dr
- 109 Sylvan Dr
- 110 Oxford Dr
- 0 Woodland Terrace
- 134 Pineview Way