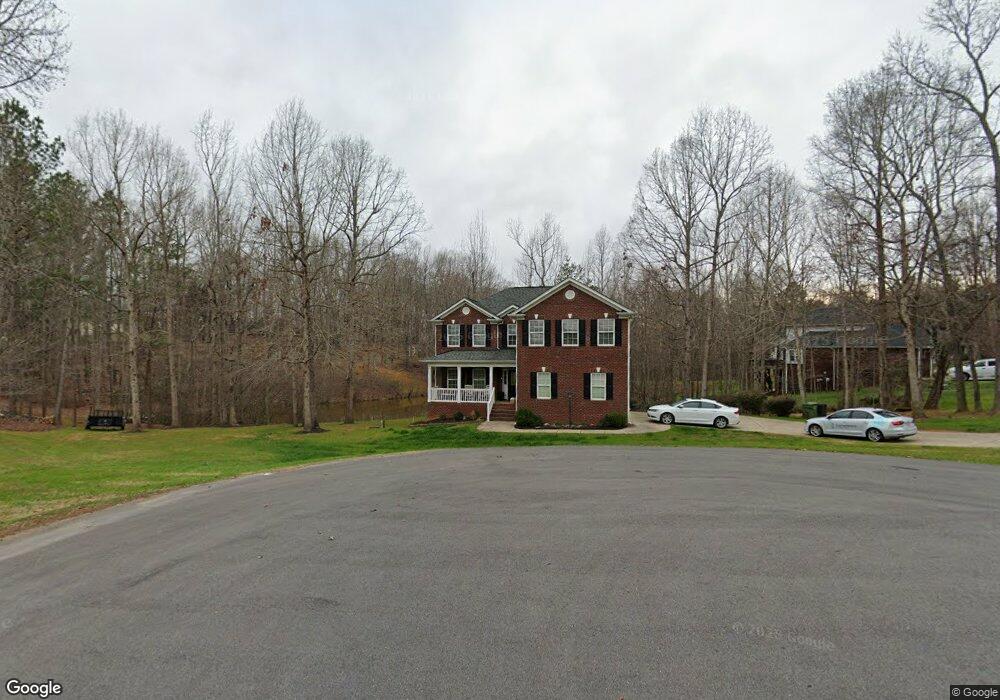
102 Parkwild Cir Unit PT21,20 Shelby, NC 28152
Estimated Value: $448,000 - $574,000
--
Bed
4
Baths
2,480
Sq Ft
$205/Sq Ft
Est. Value
About This Home
This home is located at 102 Parkwild Cir Unit PT21,20, Shelby, NC 28152 and is currently estimated at $508,920, approximately $205 per square foot. 102 Parkwild Cir Unit PT21,20 is a home located in Cleveland County with nearby schools including Springmore Elementary School, Crest Middle School, and Crest High School.
Ownership History
Date
Name
Owned For
Owner Type
Purchase Details
Closed on
Jun 16, 2009
Sold by
Johnson & Associates Real Estate Inc
Bought by
Davis Richard E and Davis Candace C
Current Estimated Value
Home Financials for this Owner
Home Financials are based on the most recent Mortgage that was taken out on this home.
Original Mortgage
$275,742
Outstanding Balance
$174,218
Interest Rate
4.77%
Mortgage Type
FHA
Estimated Equity
$334,702
Purchase Details
Closed on
Dec 22, 2008
Sold by
Cagle Keith Martin
Bought by
Johnson & Associates Real Estate Inc
Home Financials for this Owner
Home Financials are based on the most recent Mortgage that was taken out on this home.
Original Mortgage
$224,000
Interest Rate
5.96%
Mortgage Type
Credit Line Revolving
Create a Home Valuation Report for This Property
The Home Valuation Report is an in-depth analysis detailing your home's value as well as a comparison with similar homes in the area
Home Values in the Area
Average Home Value in this Area
Purchase History
| Date | Buyer | Sale Price | Title Company |
|---|---|---|---|
| Davis Richard E | $288,000 | None Available | |
| Johnson & Associates Real Estate Inc | $19,000 | None Available |
Source: Public Records
Mortgage History
| Date | Status | Borrower | Loan Amount |
|---|---|---|---|
| Open | Davis Richard E | $275,742 | |
| Previous Owner | Johnson & Associates Real Estate Inc | $224,000 |
Source: Public Records
Tax History Compared to Growth
Tax History
| Year | Tax Paid | Tax Assessment Tax Assessment Total Assessment is a certain percentage of the fair market value that is determined by local assessors to be the total taxable value of land and additions on the property. | Land | Improvement |
|---|---|---|---|---|
| 2025 | $3,999 | $451,846 | $33,835 | $418,011 |
| 2024 | $3,699 | $337,800 | $24,168 | $313,632 |
| 2023 | $3,613 | $337,800 | $24,168 | $313,632 |
| 2022 | $3,579 | $337,800 | $24,168 | $313,632 |
| 2021 | $3,597 | $337,800 | $24,168 | $313,632 |
| 2020 | $3,029 | $270,925 | $24,168 | $246,757 |
| 2019 | $3,029 | $270,925 | $24,168 | $246,757 |
| 2018 | $3,001 | $270,925 | $24,168 | $246,757 |
| 2017 | $2,959 | $270,925 | $24,168 | $246,757 |
| 2016 | $2,863 | $270,925 | $24,168 | $246,757 |
| 2015 | $2,925 | $279,508 | $24,168 | $255,340 |
| 2014 | $2,925 | $279,508 | $24,168 | $255,340 |
Source: Public Records
Map
Nearby Homes
- 00 N Main St
- 230 Poston Cir
- 2918 Lon St
- 339 W College Ave
- 0 W College Ave
- 300 Hidden Creek Dr
- 109 Landon Ct
- 116 Fairview St
- 129 Creekside Dr
- 125 Woodhill Dr
- 245 E College Ave
- 104 Tallwood Dr
- 301 Oak Ave
- 00 Cliffside Rd
- 360 Whitaker Rd
- 00 Rockford Rd
- 322 S Main St
- 125 Flint Hill Church Rd
- 133 Brookview Dr
- 325 Gwen Ln
- 102 Parkwild Cir
- 131 Twin Lake Dr
- 104 White Haven Ct
- 103 Parkwild Cir
- 133 Twin Lake Dr
- 106 Hawk Ridge Ct
- 132 Twin Lake Dr
- 128 Twin Lake Dr
- 106 Deer Run Cir
- 104 Hawk Ridge Ct
- 136 Twin Lake Dr
- 125 Twin Lake Dr
- 126 Twin Lake Dr
- 110 Hawk Ridge Rd
- 105 Hawk Ridge Ct
- 110 Hawk Ridge Ct
- 100 Hawk Ridge Ct
- 103 Deer Run Cir
- 124 Twin Lake Dr
- 107 Deer Run Cir