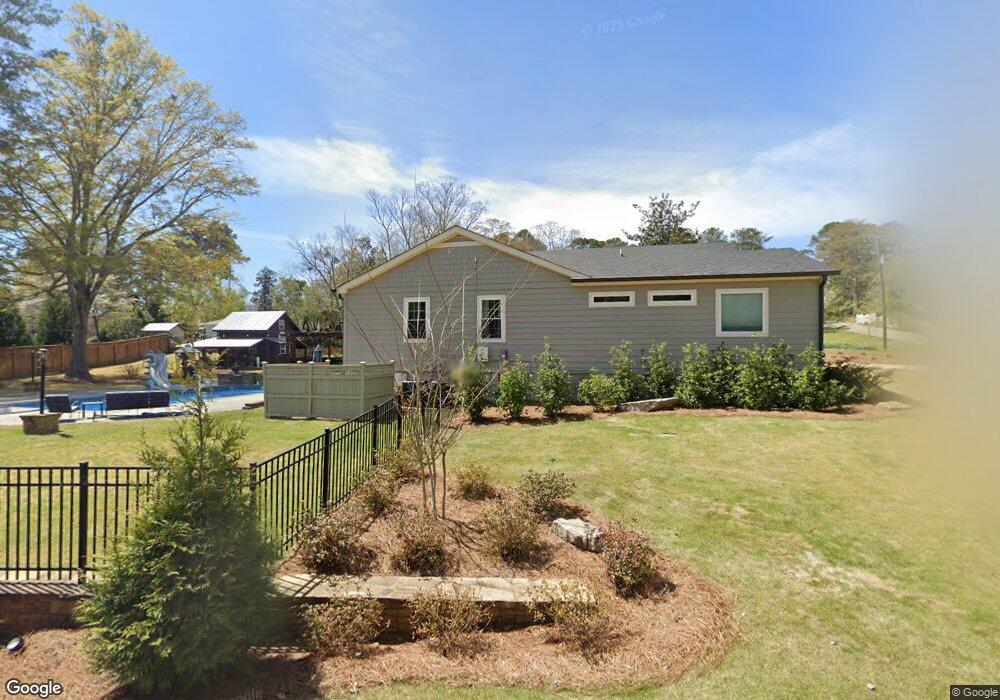
102 Pinecrest Place Carrollton, GA 30117
Estimated Value: $511,000 - $661,000
3
Beds
2
Baths
1,926
Sq Ft
$303/Sq Ft
Est. Value
About This Home
This home is located at 102 Pinecrest Place, Carrollton, GA 30117 and is currently estimated at $582,878, approximately $302 per square foot. 102 Pinecrest Place is a home located in Carroll County with nearby schools including Carrollton Elementary School, Carrollton Upper Elementary School, and Carrollton Middle School.
Ownership History
Date
Name
Owned For
Owner Type
Purchase Details
Closed on
Nov 16, 2001
Sold by
Lankford Susan D
Bought by
Whiten Wallace and Whiten Susan D
Current Estimated Value
Purchase Details
Closed on
Dec 1, 1998
Sold by
Dees William W and Dees Pat
Bought by
Lankford Susan D
Purchase Details
Closed on
Oct 18, 1996
Sold by
Mckenzie Kathryn W
Bought by
Dees William W and Dees Pat
Purchase Details
Closed on
Mar 2, 1990
Sold by
Richards Harold D and Richards Sheila P
Bought by
Mckenzie Kathryn W
Purchase Details
Closed on
Aug 1, 1988
Sold by
Flegal Myrl B Attny In Fact For
Bought by
Richards Harold D and Richards Sheila P
Purchase Details
Closed on
Apr 1, 1984
Sold by
Johnson Edwin Thomas
Bought by
Flegal Myrl B
Purchase Details
Closed on
Nov 1, 1981
Sold by
Boucher John P and Boucher Laura S
Bought by
Johnson Edwin Thomas
Purchase Details
Closed on
Dec 26, 1978
Sold by
St Margarets Church (Parsonage)
Bought by
Boucher John P and Boucher Laura S
Create a Home Valuation Report for This Property
The Home Valuation Report is an in-depth analysis detailing your home's value as well as a comparison with similar homes in the area
Home Values in the Area
Average Home Value in this Area
Purchase History
| Date | Buyer | Sale Price | Title Company |
|---|---|---|---|
| Whiten Wallace | -- | -- | |
| Lankford Susan D | $69,300 | -- | |
| Dees William W | $95,500 | -- | |
| Mckenzie Kathryn W | $73,000 | -- | |
| Richards Harold D | $70,000 | -- | |
| Flegal Myrl B | $49,000 | -- | |
| Johnson Edwin Thomas | $12,500 | -- | |
| Boucher John P | $34,000 | -- |
Source: Public Records
Tax History Compared to Growth
Tax History
| Year | Tax Paid | Tax Assessment Tax Assessment Total Assessment is a certain percentage of the fair market value that is determined by local assessors to be the total taxable value of land and additions on the property. | Land | Improvement |
|---|---|---|---|---|
| 2025 | $5,636 | $243,372 | $31,948 | $211,424 |
| 2024 | $5,812 | $243,372 | $31,948 | $211,424 |
| 2023 | $5,812 | $225,354 | $31,949 | $193,405 |
| 2022 | $4,856 | $187,221 | $31,949 | $155,272 |
| 2021 | $4,379 | $166,470 | $31,949 | $134,521 |
| 2020 | $2,484 | $97,749 | $31,949 | $65,800 |
| 2019 | $2,404 | $93,445 | $31,949 | $61,496 |
| 2018 | $2,322 | $88,943 | $31,949 | $56,994 |
| 2017 | $2,331 | $88,943 | $31,949 | $56,994 |
| 2016 | $2,344 | $88,943 | $31,949 | $56,994 |
| 2015 | $1,611 | $56,157 | $14,352 | $41,805 |
| 2014 | $1,618 | $56,157 | $14,352 | $41,805 |
Source: Public Records
Map
Nearby Homes
- 166 Maple St
- 142 Griffin Dr
- 223 Sunset Blvd
- 141 Bowen St
- 105 Haygood Place
- 1818 Maple St
- 74 Old Mill Ct
- 308 Old Mill Dr
- 117 Orion Terrace
- 30 Lynda Cir
- 516 Longview St
- 219 Broad St
- 114 Second St
- 130 Maple Crossing Unit 1
- 130 Maple Crossing Unit LOT 2
- 0 Hwy 27 None N
- 160 Watson St
- 107 Magnolia Ln
- 334 Maple View Dr
- 388 Maple View Dr
- 108 Pinecrest Place
- 104 Golfview Ct
- 106 Golfview Ct
- 106 Golfview Ct
- 106 Golfview Ct
- 106 Golfview Ct
- 132 Hillcrest Rd
- 102 Golfview Ct
- 129 Hillcrest Rd
- 120 Hillcrest Rd
- 114 Pinecrest Place
- 120 E Club Dr
- 128 Hillcrest Rd
- 107 Golfview Ct
- 110 Golfview Ct Unit LOT 1
- 110 Golfview Ct Unit LOT 3
- 110 Golfview Ct Unit LOT 2
- 110 Golfview Ct
- 151 Howell Rd
- 115 Pinecrest Place