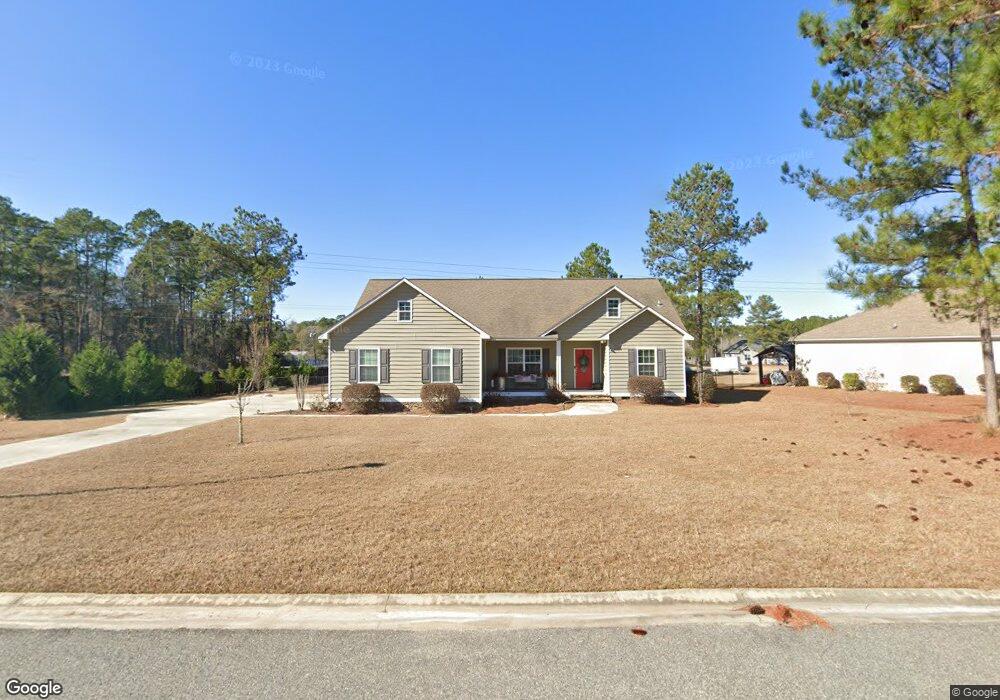
102 Planters Row Tifton, GA 31793
Estimated Value: $254,000 - $272,000
3
Beds
2
Baths
1,529
Sq Ft
$170/Sq Ft
Est. Value
About This Home
This home is located at 102 Planters Row, Tifton, GA 31793 and is currently estimated at $260,411, approximately $170 per square foot. 102 Planters Row is a home located in Tift County with nearby schools including Len Lastinger Primary School, Matt Wilson Elementary School, and J.T. Reddick School.
Ownership History
Date
Name
Owned For
Owner Type
Purchase Details
Closed on
Dec 17, 2015
Sold by
Griffin Mathew M
Bought by
Brownlee Claire S
Current Estimated Value
Home Financials for this Owner
Home Financials are based on the most recent Mortgage that was taken out on this home.
Original Mortgage
$161,439
Outstanding Balance
$128,137
Interest Rate
3.98%
Mortgage Type
New Conventional
Estimated Equity
$132,274
Purchase Details
Closed on
Jul 29, 2013
Sold by
Lindsey Framing Llc
Bought by
Griffin Mathew M and Griffin Ellen Y
Home Financials for this Owner
Home Financials are based on the most recent Mortgage that was taken out on this home.
Original Mortgage
$123,300
Interest Rate
4.43%
Mortgage Type
New Conventional
Purchase Details
Closed on
Sep 11, 2012
Sold by
Mill Ridge Crossing Llc
Bought by
Lindsey Framing Llc
Create a Home Valuation Report for This Property
The Home Valuation Report is an in-depth analysis detailing your home's value as well as a comparison with similar homes in the area
Home Values in the Area
Average Home Value in this Area
Purchase History
| Date | Buyer | Sale Price | Title Company |
|---|---|---|---|
| Brownlee Claire S | $153,000 | -- | |
| Griffin Mathew M | $137,000 | -- | |
| Lindsey Framing Llc | $20,000 | -- |
Source: Public Records
Mortgage History
| Date | Status | Borrower | Loan Amount |
|---|---|---|---|
| Open | Brownlee Claire S | $161,439 | |
| Previous Owner | Griffin Mathew M | $123,300 |
Source: Public Records
Tax History Compared to Growth
Tax History
| Year | Tax Paid | Tax Assessment Tax Assessment Total Assessment is a certain percentage of the fair market value that is determined by local assessors to be the total taxable value of land and additions on the property. | Land | Improvement |
|---|---|---|---|---|
| 2024 | $2,858 | $99,698 | $14,000 | $85,698 |
| 2023 | $2,858 | $70,702 | $7,800 | $62,902 |
| 2022 | $2,661 | $70,702 | $7,800 | $62,902 |
| 2021 | $1,980 | $52,262 | $7,800 | $44,462 |
| 2020 | $2,029 | $52,262 | $7,800 | $44,462 |
| 2019 | $2,030 | $52,262 | $7,800 | $44,462 |
| 2018 | $2,030 | $52,262 | $7,800 | $44,462 |
| 2017 | $2,083 | $52,262 | $7,800 | $44,462 |
| 2016 | $2,086 | $52,262 | $7,800 | $44,462 |
| 2015 | $2,088 | $52,262 | $7,800 | $44,462 |
| 2014 | $2,091 | $52,262 | $7,800 | $44,462 |
| 2013 | -- | $42,108 | $7,800 | $34,308 |
Source: Public Records
Map
Nearby Homes
- Tract 2 Whiddon Mill Rd
- Tract 1 Whiddon Mill Rd
- 100 Elizabeth Dr
- 78 Chase Cir
- 1808 Rutland Rd
- 1901 Melba Dr
- 1607 Mallard Ln
- 4429 Frazier Cir
- 0 W Hutchinson Rd
- 2404 Northfield Rd
- 0 Carpenter Rd N
- 26 Alan Ln
- W Hutchinson Rd
- 7 Deborah Dr
- 0 Carpenter Rd
- o Carpenter Rd
- 307 Fulwood Blvd
- 0 S Carpenter Rd
- 225 Alabama Dr
- 0 N U S Hwy 41
- 106 Planters Row
- - Whiddon Mill Rd
- 00 Whiddon Mill Rd
- Tract 3 Whiddon Mill Rd
- 104 Planters Row
- Lot 1 Planters Row
- Lot 3 Planters Row
- Lot 2 Planters Row
- 101 Planters Row
- 154 Mill Ridge Cir
- 108 Planters Row
- 111 Planters Row
- 103 Planters Row
- 133 Oak Point Ave
- 110 Planters Row
- 128 Oak Point Ave
- 150 Mill Ridge Cir
- 131 Oak Point Ave
- 142 Mill Ridge Cir
- 124 Oak Point Ave