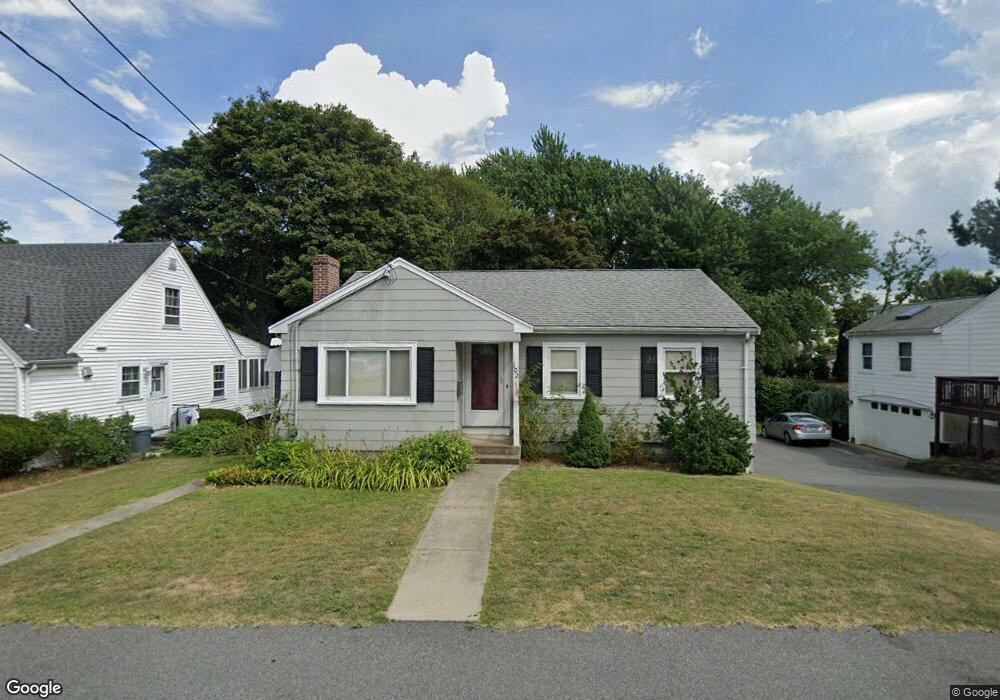
102 Roberts St Quincy, MA 02169
South Quincy NeighborhoodEstimated Value: $528,000 - $563,753
2
Beds
1
Bath
864
Sq Ft
$634/Sq Ft
Est. Value
About This Home
This home is located at 102 Roberts St, Quincy, MA 02169 and is currently estimated at $547,938, approximately $634 per square foot. 102 Roberts St is a home located in Norfolk County with nearby schools including South West Middle School, Lincoln-Hancock Community School, and Quincy High School.
Ownership History
Date
Name
Owned For
Owner Type
Purchase Details
Closed on
Nov 28, 2011
Sold by
Bates Jean C
Bought by
102 Roberts St Rt and Bates Jean C
Current Estimated Value
Purchase Details
Closed on
Sep 20, 2006
Sold by
102 Roberts Street T and Spere Eunice E
Bought by
Bates Thomas G and Bates Jean
Home Financials for this Owner
Home Financials are based on the most recent Mortgage that was taken out on this home.
Original Mortgage
$200,000
Interest Rate
6.59%
Mortgage Type
Purchase Money Mortgage
Create a Home Valuation Report for This Property
The Home Valuation Report is an in-depth analysis detailing your home's value as well as a comparison with similar homes in the area
Home Values in the Area
Average Home Value in this Area
Purchase History
| Date | Buyer | Sale Price | Title Company |
|---|---|---|---|
| 102 Roberts St Rt | -- | -- | |
| Bates Thomas G | $274,000 | -- |
Source: Public Records
Mortgage History
| Date | Status | Borrower | Loan Amount |
|---|---|---|---|
| Previous Owner | Bates Thomas G | $200,000 |
Source: Public Records
Tax History Compared to Growth
Tax History
| Year | Tax Paid | Tax Assessment Tax Assessment Total Assessment is a certain percentage of the fair market value that is determined by local assessors to be the total taxable value of land and additions on the property. | Land | Improvement |
|---|---|---|---|---|
| 2025 | $5,591 | $484,900 | $311,400 | $173,500 |
| 2024 | $5,279 | $468,400 | $296,600 | $171,800 |
| 2023 | $4,878 | $438,300 | $269,800 | $168,500 |
| 2022 | $4,624 | $386,000 | $225,000 | $161,000 |
| 2021 | $4,471 | $368,300 | $225,000 | $143,300 |
| 2020 | $4,404 | $354,300 | $225,000 | $129,300 |
| 2019 | $4,278 | $340,900 | $212,400 | $128,500 |
| 2018 | $4,159 | $311,800 | $196,800 | $115,000 |
| 2017 | $4,080 | $287,900 | $187,400 | $100,500 |
| 2016 | $3,706 | $258,100 | $163,200 | $94,900 |
| 2015 | $3,704 | $253,700 | $163,200 | $90,500 |
| 2014 | $3,681 | $247,700 | $163,200 | $84,500 |
Source: Public Records
Map
Nearby Homes
- 21 Totman St Unit 202
- 21 Totman St Unit 309
- 21 Totman St Unit Model-1
- 21 Totman St Unit 209
- 21 Totman St Unit 2
- 347 Centre St
- 94 Brook Rd Unit 3
- 64 Garfield St Unit B
- 91 Garfield St
- 21 Arthur St
- 56 Penn St Unit 4
- 12 Arthur Ave
- 51 Brook Rd
- 14 Arthur Ave
- 57 Buckley St
- 72 Federal Ave
- 42 West St
- 46-48 Buckley St
- 8 Jackson St Unit B2
- 46 Suomi Rd
- 96 Roberts St
- 106 Roberts St
- 72 Nightingale Ave
- 70 Nightingale Ave
- 107 Roberts St
- 66 Nightingale Ave
- 97 Roberts St
- 97 Roberts St
- 97 Roberts St Unit 1
- 97 Roberts St Unit 97
- 112 Roberts St
- 109 Brooks Ave
- 95 Roberts St Unit 95
- 95 Roberts St
- 103 Brooks Ave
- 111-113 Roberts St
- 111 Roberts St Unit 111
- 111 Roberts St
- 62 Nightingale Ave
- 113 Roberts St