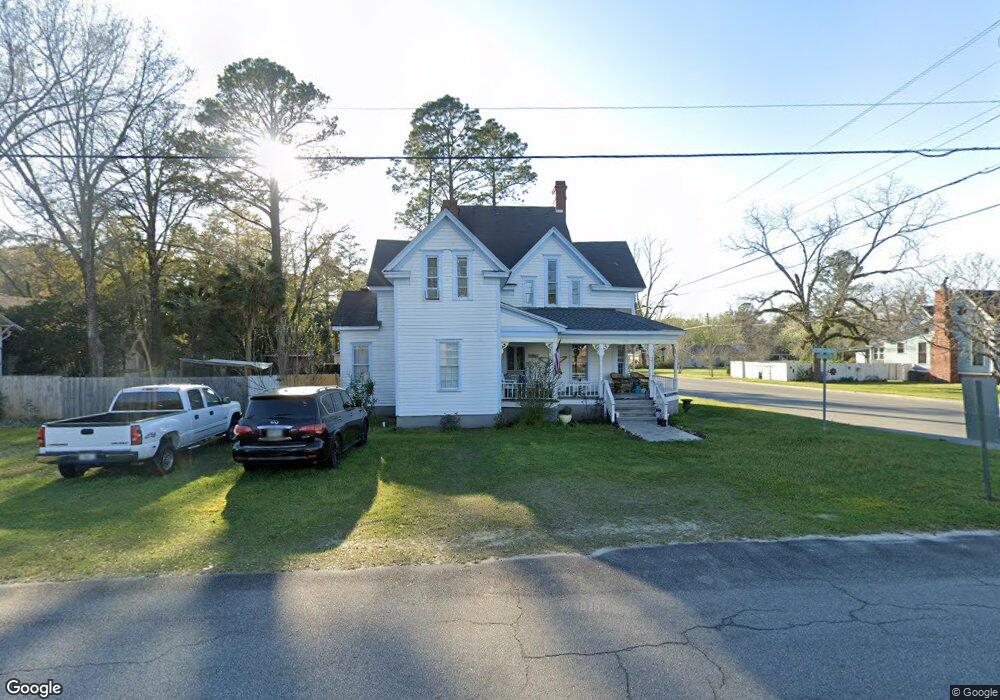
102 S College St Sparks, GA 31647
Estimated Value: $125,576 - $158,000
4
Beds
4
Baths
3,378
Sq Ft
$41/Sq Ft
Est. Value
About This Home
This home is located at 102 S College St, Sparks, GA 31647 and is currently estimated at $140,144, approximately $41 per square foot. 102 S College St is a home located in Cook County with nearby schools including Cook Primary School, Cook Elementary School, and Cook County Middle School.
Ownership History
Date
Name
Owned For
Owner Type
Purchase Details
Closed on
Aug 21, 2015
Sold by
Hamlin Michelle
Bought by
Music Darren C
Current Estimated Value
Home Financials for this Owner
Home Financials are based on the most recent Mortgage that was taken out on this home.
Original Mortgage
$85,914
Outstanding Balance
$67,201
Interest Rate
3.87%
Mortgage Type
FHA
Estimated Equity
$72,943
Purchase Details
Closed on
Apr 10, 2013
Sold by
Sec Of Housing & U
Bought by
Hamlin Michelle
Home Financials for this Owner
Home Financials are based on the most recent Mortgage that was taken out on this home.
Original Mortgage
$28,346
Interest Rate
3.65%
Mortgage Type
New Conventional
Purchase Details
Closed on
Jun 5, 2012
Sold by
Wells Fargo Bank National
Bought by
Sec Of Housing & Urban
Create a Home Valuation Report for This Property
The Home Valuation Report is an in-depth analysis detailing your home's value as well as a comparison with similar homes in the area
Home Values in the Area
Average Home Value in this Area
Purchase History
| Date | Buyer | Sale Price | Title Company |
|---|---|---|---|
| Music Darren C | $87,500 | -- | |
| Hamlin Michelle | -- | -- | |
| Sec Of Housing & Urban | $82,400 | -- | |
| Wells Fargo Bank National Asso | $82,400 | -- |
Source: Public Records
Mortgage History
| Date | Status | Borrower | Loan Amount |
|---|---|---|---|
| Open | Music Darren C | $85,914 | |
| Previous Owner | Hamlin Michelle | $28,346 |
Source: Public Records
Tax History Compared to Growth
Tax History
| Year | Tax Paid | Tax Assessment Tax Assessment Total Assessment is a certain percentage of the fair market value that is determined by local assessors to be the total taxable value of land and additions on the property. | Land | Improvement |
|---|---|---|---|---|
| 2024 | $1,023 | $30,023 | $2,283 | $27,740 |
| 2023 | $874 | $25,642 | $2,038 | $23,604 |
| 2022 | $691 | $25,642 | $2,038 | $23,604 |
| 2021 | $606 | $20,986 | $2,038 | $18,948 |
| 2020 | $606 | $20,986 | $2,038 | $18,948 |
| 2019 | $606 | $20,986 | $2,038 | $18,948 |
| 2018 | $769 | $20,986 | $2,038 | $18,948 |
| 2017 | $607 | $20,986 | $2,038 | $18,948 |
| 2016 | $608 | $20,986 | $2,038 | $18,948 |
| 2015 | $553 | $20,986 | $2,038 | $18,948 |
| 2014 | $310 | $45,796 | $2,038 | $43,758 |
| 2013 | -- | $45,796 | $2,038 | $43,758 |
Source: Public Records
Map
Nearby Homes
- 103 N College St
- 134 Brandy Ct
- 284 Barrett Rd
- 105 Orchard Cir
- 120 Westover Dr
- 123 Westover Dr
- 2302 Thomas St
- 1402 Bear Creek Rd
- 1306 Bear Creek Rd
- 703 N Elm St
- 2603 Dianne St
- 2503 Dianne St
- 4711 Highway 37
- 701 Gloria St
- 304 E 3rd St
- 418 E 3rd St
- 315 Newton Dr
- 211 S Gordon Ave
- 625 Coxstill Rd
- 901 E 4th St
- TBD College St
- 111 W Colquitt St
- 104 S College St
- 201 1/2 W Colquitt St
- 201 W Colquitt St
- 103 S College St
- 101 N College St
- 106 S College St
- 114 W Colquitt St
- 105 S College St
- 203 W Colquitt St
- 108 S College St Unit 5
- 108 S College St
- 107 S College St
- 155 W Gordon St
- 105 N College St
- 110 S College St
- 203 Colquitt
- 109 S College St
- 204 W Colquitt St