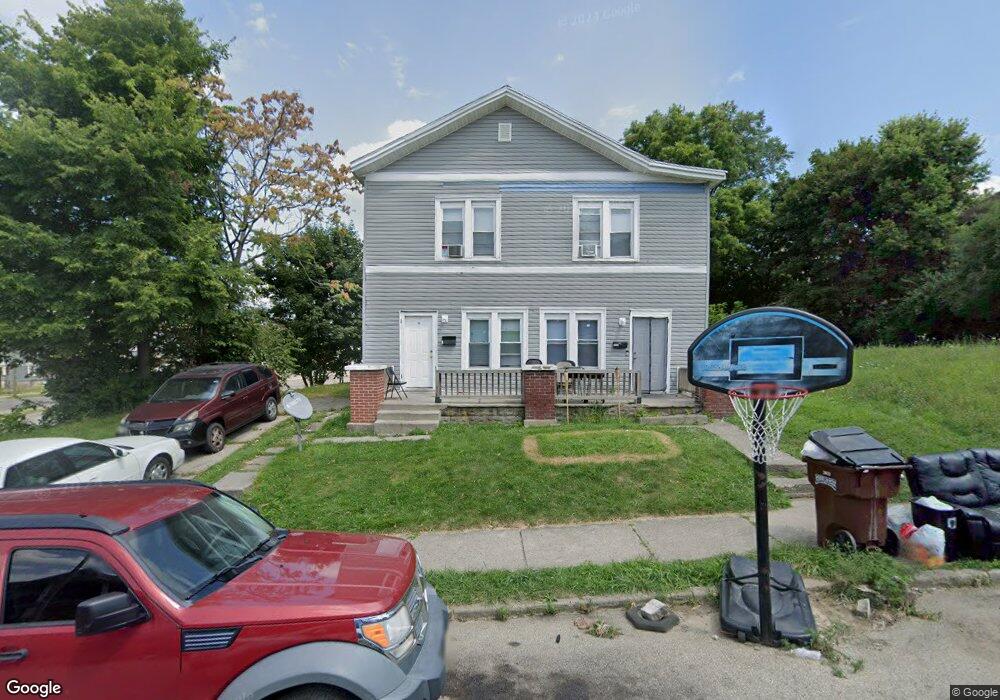
102 S Race St Unit 104 Springfield, OH 45506
Estimated Value: $81,552 - $87,000
4
Beds
2
Baths
2,352
Sq Ft
$36/Sq Ft
Est. Value
About This Home
This home is located at 102 S Race St Unit 104, Springfield, OH 45506 and is currently estimated at $83,638, approximately $35 per square foot. 102 S Race St Unit 104 is a home located in Clark County with nearby schools including Fulton Elementary School, Hayward Middle School, and Springfield High School.
Ownership History
Date
Name
Owned For
Owner Type
Purchase Details
Closed on
Jun 3, 2025
Sold by
Lt Pathways Llc
Bought by
Ebk 300 Limited
Current Estimated Value
Purchase Details
Closed on
Dec 30, 2022
Sold by
Gudorf Tyler
Bought by
Lt Pathways Llc
Purchase Details
Closed on
Mar 8, 2022
Sold by
John A Gudorf Revocable Trust
Bought by
Gudorf Tyler
Purchase Details
Closed on
Apr 20, 2011
Sold by
Gudorf John A and Gudorf Mary J
Bought by
Gudorf John A and John A Gudorf Revocable Trust
Purchase Details
Closed on
Nov 18, 2005
Sold by
Wells Fargo Bank Na
Bought by
Gudorf John A
Purchase Details
Closed on
Jul 13, 2005
Sold by
Pauley Franklin D
Bought by
Wells Fargo Bank Na and Structured Asset Securities Corp Amortiz
Create a Home Valuation Report for This Property
The Home Valuation Report is an in-depth analysis detailing your home's value as well as a comparison with similar homes in the area
Home Values in the Area
Average Home Value in this Area
Purchase History
| Date | Buyer | Sale Price | Title Company |
|---|---|---|---|
| Ebk 300 Limited | $81,300 | None Listed On Document | |
| Lt Pathways Llc | $70,000 | -- | |
| Gudorf Tyler | -- | Jeffries Jacob M | |
| Gudorf Tyler | -- | None Listed On Document | |
| Gudorf John A | -- | None Available | |
| Gudorf John A | $14,100 | -- | |
| Wells Fargo Bank Na | $20,000 | -- |
Source: Public Records
Tax History Compared to Growth
Tax History
| Year | Tax Paid | Tax Assessment Tax Assessment Total Assessment is a certain percentage of the fair market value that is determined by local assessors to be the total taxable value of land and additions on the property. | Land | Improvement |
|---|---|---|---|---|
| 2024 | $678 | $13,730 | $2,840 | $10,890 |
| 2023 | $678 | $13,730 | $2,840 | $10,890 |
| 2022 | $706 | $13,730 | $2,840 | $10,890 |
| 2021 | $706 | $12,840 | $2,660 | $10,180 |
| 2020 | $707 | $12,840 | $2,660 | $10,180 |
| 2019 | $709 | $12,840 | $2,660 | $10,180 |
| 2018 | $490 | $8,510 | $2,220 | $6,290 |
| 2017 | $489 | $8,502 | $2,216 | $6,286 |
| 2016 | $490 | $8,502 | $2,216 | $6,286 |
| 2015 | $250 | $8,502 | $2,216 | $6,286 |
| 2014 | $249 | $8,502 | $2,216 | $6,286 |
| 2013 | $246 | $8,502 | $2,216 | $6,286 |
Source: Public Records
Map
Nearby Homes
- 0 S Plum St
- 681 W Jefferson St Unit 683
- 522 W North St Unit 524
- 1120 W High St
- 317 S Plum St
- 222 N Race St Unit 224
- 1009 W High St
- 833 W Mulberry St
- 101`103 N Western
- 935 W North St Unit 935
- 516 W Clark St
- 20 N Center St
- 38 W High St Unit 3B
- 25 Mill Run Place
- 1205 W High St
- 423 N Jackson St Unit 425
- 830 Dibert Ave
- 702 S Wittenberg Ave
- 366 N Isabella St
- 411 S Limestone St
- 102-104 S Race St
- 118 S Race St Unit 120
- 534 W Washington St
- 530 W Washington St
- 602 W High St
- 109 S Race St Unit 111
- 101 S Race St Unit 101
- 538 W High St
- 608 W High St Unit 610
- 524 W Washington St
- 121 S Yellow Springs St
- 130 S Race St Unit 132
- 35 S Race St
- 532 W High St Unit 534
- 121 S Race St
- 616 W High St Unit 616
- 32 S Race St
- 125 S Race St
- 622 W High St
- 528 W High St Unit 530