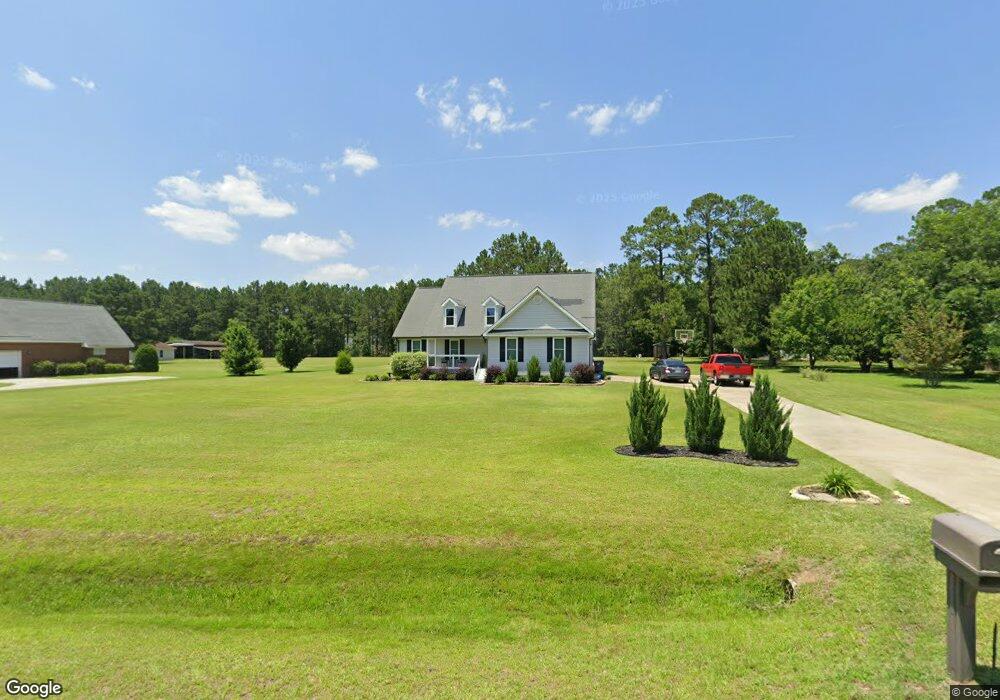
102 Saddle Creek Dr Unit B Cordele, GA 31015
Estimated Value: $137,000 - $192,000
3
Beds
2
Baths
1,456
Sq Ft
$118/Sq Ft
Est. Value
About This Home
This home is located at 102 Saddle Creek Dr Unit B, Cordele, GA 31015 and is currently estimated at $171,858, approximately $118 per square foot. 102 Saddle Creek Dr Unit B is a home located in Crisp County with nearby schools including Crisp County Elementary School, Crisp County Primary School, and Crisp County Middle School.
Ownership History
Date
Name
Owned For
Owner Type
Purchase Details
Closed on
Oct 26, 2018
Sold by
Allison Ashley Brian
Bought by
Allison Ashley Brian and Allison Karen
Current Estimated Value
Home Financials for this Owner
Home Financials are based on the most recent Mortgage that was taken out on this home.
Original Mortgage
$100,000
Outstanding Balance
$87,223
Interest Rate
4.7%
Mortgage Type
New Conventional
Estimated Equity
$84,635
Purchase Details
Closed on
Oct 19, 2018
Sold by
Allison Sam
Bought by
Allison Ashley Brian
Home Financials for this Owner
Home Financials are based on the most recent Mortgage that was taken out on this home.
Original Mortgage
$100,000
Outstanding Balance
$87,223
Interest Rate
4.7%
Mortgage Type
New Conventional
Estimated Equity
$84,635
Purchase Details
Closed on
Aug 15, 2003
Sold by
Merit Trading Corp
Bought by
Allison Samuel C
Purchase Details
Closed on
Jan 7, 2003
Sold by
Baker James Farrow
Bought by
Merit Trading Corp
Purchase Details
Closed on
Aug 11, 1992
Sold by
Sapp Jimmy H and Sapp Tere
Bought by
Baker James Farrow
Create a Home Valuation Report for This Property
The Home Valuation Report is an in-depth analysis detailing your home's value as well as a comparison with similar homes in the area
Home Values in the Area
Average Home Value in this Area
Purchase History
| Date | Buyer | Sale Price | Title Company |
|---|---|---|---|
| Allison Ashley Brian | -- | -- | |
| Allison Ashley Brian | -- | -- | |
| Allison Samuel C | $120,000 | -- | |
| Merit Trading Corp | $16,000 | -- | |
| Baker James Farrow | $10,200 | -- |
Source: Public Records
Mortgage History
| Date | Status | Borrower | Loan Amount |
|---|---|---|---|
| Open | Allison Ashley Brian | $100,000 |
Source: Public Records
Tax History Compared to Growth
Tax History
| Year | Tax Paid | Tax Assessment Tax Assessment Total Assessment is a certain percentage of the fair market value that is determined by local assessors to be the total taxable value of land and additions on the property. | Land | Improvement |
|---|---|---|---|---|
| 2025 | $1,443 | $61,078 | $3,020 | $58,058 |
| 2024 | $1,443 | $55,298 | $1,812 | $53,486 |
| 2023 | $1,440 | $53,270 | $1,812 | $51,458 |
| 2022 | $1,430 | $52,930 | $1,812 | $51,118 |
| 2021 | $1,486 | $50,118 | $1,812 | $48,306 |
| 2020 | $1,429 | $50,118 | $1,812 | $48,306 |
| 2019 | $1,479 | $50,118 | $1,812 | $48,306 |
| 2018 | $1,520 | $49,631 | $3,020 | $46,611 |
| 2017 | $1,526 | $49,631 | $3,020 | $46,611 |
| 2016 | $1,463 | $49,631 | $3,020 | $46,611 |
| 2015 | -- | $49,631 | $3,020 | $46,611 |
| 2014 | -- | $49,631 | $3,020 | $46,611 |
| 2013 | -- | $49,631 | $3,020 | $46,611 |
Source: Public Records
Map
Nearby Homes
- 127 Hill Rd
- 1607 Georgia 257
- 1643 Ga Highway 257
- 703 N Pecan St
- 1009 E Tulip Ave
- 1015 E 8th Ave
- 705 Starr Place
- 0 Old Nesbitt Rd
- 405 N Bay St
- 160 Old Nesbitt Rd
- TBD S Greer St
- 0 S Greer St
- 603 E 1st Ave
- TBD N Pecan St
- 413 E 2nd Ave
- 3041 E Ga Hwy 280
- 1509 E 20th Ave
- 612 E 12th Ave
- 1001 Stewart Ave
- 511 E 13th Ave
- 102A Saddle Creek Dr
- 101 Saddle Creek Dr
- 105 Saddle Creek Dr
- TBD Georgia 257
- 00 Georgia 257
- 1407 Georgia 257
- 104 Saddle Creek Dr
- 1493 Ga Highway 257
- 106 Appaloosa Way
- 106 Saddle Creek Dr
- 1464 Ga Highway 257
- 1458 Georgia 257
- 107 Saddle Creek Dr
- 1464 Georgia 257
- 1452 Ga Highway 257
- 1441 Ga Highway 257
- 104 Appaloosa Way
- 1496 Georgia 257
- 1496 Ga Highway 257
- 1442 Ga Highway 257