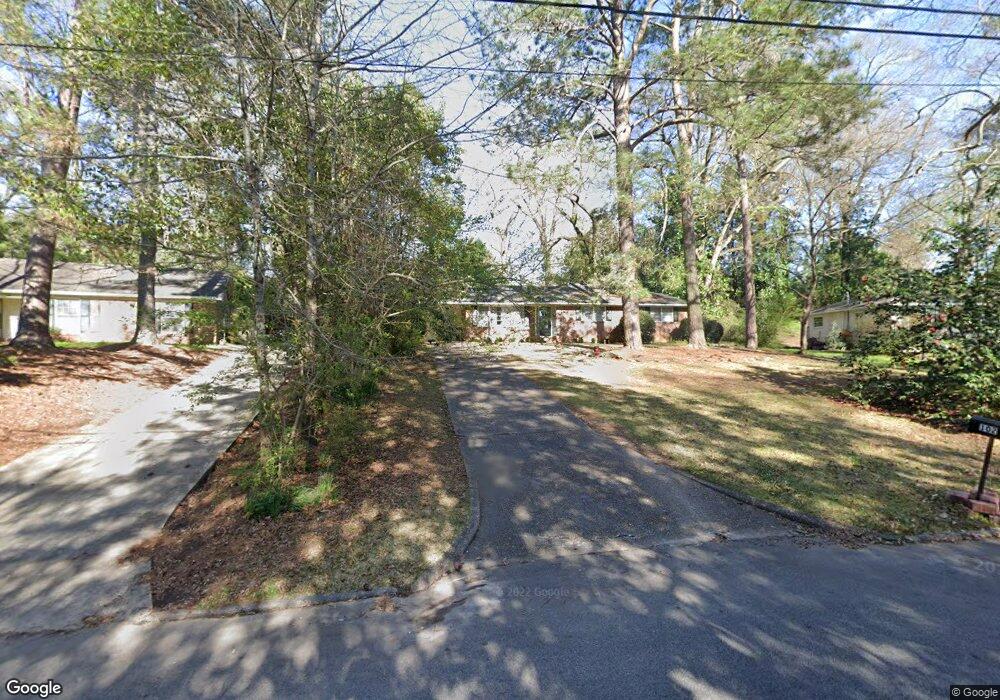
102 Saynor Cir Lagrange, GA 30240
Estimated Value: $231,080 - $263,000
3
Beds
2
Baths
1,526
Sq Ft
$163/Sq Ft
Est. Value
About This Home
This home is located at 102 Saynor Cir, Lagrange, GA 30240 and is currently estimated at $248,270, approximately $162 per square foot. 102 Saynor Cir is a home located in Troup County with nearby schools including Hollis Hand Elementary School, Ethel W. Kight Elementary School, and Franklin Forest Elementary School.
Ownership History
Date
Name
Owned For
Owner Type
Purchase Details
Closed on
Jul 31, 2007
Sold by
Lundy Richard
Bought by
Harry Laurie Ann
Current Estimated Value
Home Financials for this Owner
Home Financials are based on the most recent Mortgage that was taken out on this home.
Original Mortgage
$93,000
Outstanding Balance
$58,581
Interest Rate
6.56%
Mortgage Type
New Conventional
Estimated Equity
$189,689
Purchase Details
Closed on
Jun 3, 2002
Sold by
Marion A Skelton
Bought by
Penelope A Reagan
Purchase Details
Closed on
Oct 2, 1972
Sold by
Rowe James F and Julia Ann
Bought by
Marion A Skelton
Purchase Details
Closed on
Jan 1, 1972
Sold by
Jackson Robert P
Bought by
Rowe James F and Julia Ann
Purchase Details
Closed on
Sep 1, 1968
Sold by
Ellington Ralph D
Bought by
Jackson Robert P
Create a Home Valuation Report for This Property
The Home Valuation Report is an in-depth analysis detailing your home's value as well as a comparison with similar homes in the area
Home Values in the Area
Average Home Value in this Area
Purchase History
| Date | Buyer | Sale Price | Title Company |
|---|---|---|---|
| Harry Laurie Ann | $145,000 | -- | |
| Penelope A Reagan | $99,500 | -- | |
| Marion A Skelton | $28,500 | -- | |
| Rowe James F | $26,000 | -- | |
| Jackson Robert P | $21,500 | -- |
Source: Public Records
Mortgage History
| Date | Status | Borrower | Loan Amount |
|---|---|---|---|
| Open | Harry Laurie Ann | $93,000 |
Source: Public Records
Tax History Compared to Growth
Tax History
| Year | Tax Paid | Tax Assessment Tax Assessment Total Assessment is a certain percentage of the fair market value that is determined by local assessors to be the total taxable value of land and additions on the property. | Land | Improvement |
|---|---|---|---|---|
| 2024 | $1,688 | $63,884 | $18,000 | $45,884 |
| 2023 | $1,576 | $59,768 | $18,000 | $41,768 |
| 2022 | $1,538 | $57,088 | $18,000 | $39,088 |
| 2021 | $1,269 | $44,076 | $10,960 | $33,116 |
| 2020 | $1,269 | $44,076 | $10,960 | $33,116 |
| 2019 | $1,222 | $42,508 | $10,960 | $31,548 |
| 2018 | $1,177 | $41,024 | $10,960 | $30,064 |
| 2017 | $972 | $34,220 | $9,500 | $24,720 |
| 2016 | $962 | $33,895 | $9,500 | $24,395 |
| 2015 | $998 | $35,024 | $10,629 | $24,395 |
| 2014 | $985 | $34,521 | $10,629 | $23,892 |
| 2013 | -- | $37,764 | $10,544 | $27,220 |
Source: Public Records
Map
Nearby Homes
- 105 Saynor Cir
- 408 Gordon St
- 203 Waverly Way
- 110 Waverly Way
- 705 Piney Woods Dr
- 206 Broad St
- 609 Cherokee Rd
- 609 Ridley Ave
- 707 Ridley Ave
- 611 Ridley Ave
- 615 Ridley Ave
- 709 Ridley Ave
- 0 Ridley Ave Unit 10550104
- 219 Banks St
- 209 Boulevard
- 208 Boulevard
- 109 Thomas St
- 301 E Bacon St
- 145 Turner St
- 505 S Lewis St