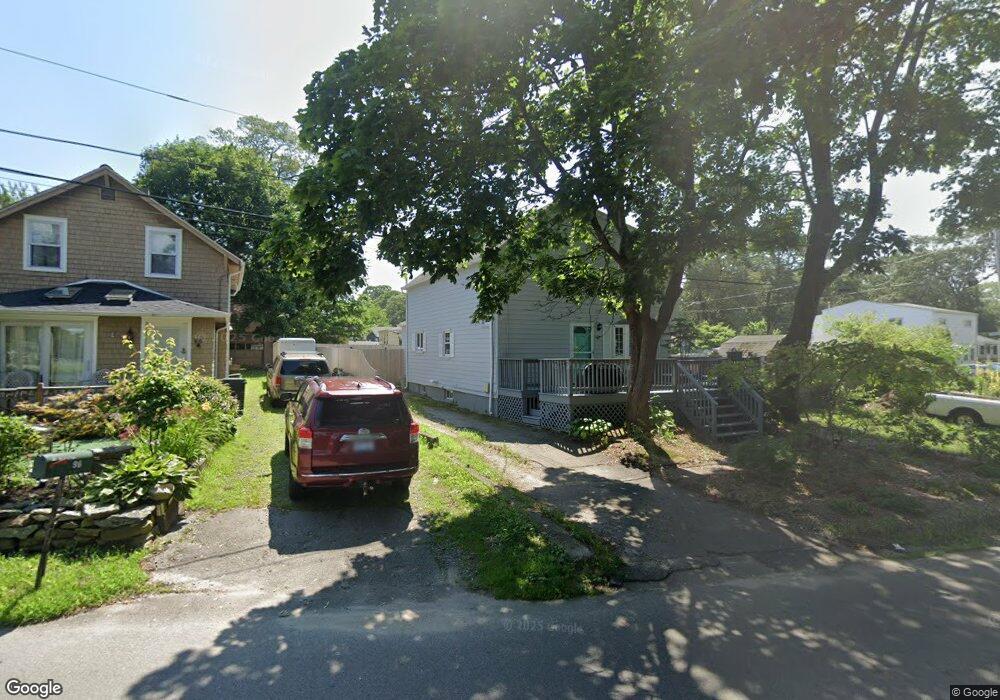
102 Sea View Dr Warwick, RI 02889
Oakland Beach NeighborhoodEstimated Value: $382,000 - $436,000
3
Beds
2
Baths
1,586
Sq Ft
$256/Sq Ft
Est. Value
About This Home
This home is located at 102 Sea View Dr, Warwick, RI 02889 and is currently estimated at $406,535, approximately $256 per square foot. 102 Sea View Dr is a home located in Kent County with nearby schools including Saint Kevin School, St Rose Of Lima School, and Bishop Hendricken High School.
Ownership History
Date
Name
Owned For
Owner Type
Purchase Details
Closed on
Oct 29, 2008
Sold by
Deutsche Bank Natl T C
Bought by
Kelly Catherine A
Current Estimated Value
Home Financials for this Owner
Home Financials are based on the most recent Mortgage that was taken out on this home.
Original Mortgage
$153,851
Interest Rate
5.83%
Mortgage Type
Purchase Money Mortgage
Purchase Details
Closed on
Aug 21, 2008
Sold by
Wholey Jennifer and Deutsche Bank Natl T C
Bought by
Deutsche Bank Natl T C
Purchase Details
Closed on
Sep 28, 2005
Sold by
Gagnon Edduard L and Gagnon Candace J
Bought by
Wholey Jennifer
Purchase Details
Closed on
Sep 19, 2001
Sold by
Botelho-Salamone Carol
Bought by
Gagnon Eddelard L and Gagnon Candace J
Purchase Details
Closed on
Nov 10, 1997
Sold by
Hallock Diana L
Bought by
Hallock Christopher E
Create a Home Valuation Report for This Property
The Home Valuation Report is an in-depth analysis detailing your home's value as well as a comparison with similar homes in the area
Home Values in the Area
Average Home Value in this Area
Purchase History
| Date | Buyer | Sale Price | Title Company |
|---|---|---|---|
| Kelly Catherine A | $155,500 | -- | |
| Deutsche Bank Natl T C | $173,445 | -- | |
| Wholey Jennifer | $223,000 | -- | |
| Gagnon Eddelard L | $150,000 | -- | |
| Hallock Christopher E | $82,000 | -- |
Source: Public Records
Mortgage History
| Date | Status | Borrower | Loan Amount |
|---|---|---|---|
| Open | Hallock Christopher E | $149,858 | |
| Closed | Hallock Christopher E | $153,851 |
Source: Public Records
Tax History
| Year | Tax Paid | Tax Assessment Tax Assessment Total Assessment is a certain percentage of the fair market value that is determined by local assessors to be the total taxable value of land and additions on the property. | Land | Improvement |
|---|---|---|---|---|
| 2025 | $4,728 | $372,300 | $149,700 | $222,600 |
| 2024 | $4,489 | $310,200 | $120,600 | $189,600 |
| 2023 | $4,402 | $310,200 | $120,600 | $189,600 |
| 2022 | $4,181 | $223,200 | $72,900 | $150,300 |
| 2021 | $4,181 | $223,200 | $72,900 | $150,300 |
| 2020 | $4,181 | $223,200 | $72,900 | $150,300 |
| 2019 | $4,181 | $223,200 | $72,900 | $150,300 |
| 2018 | $3,702 | $178,000 | $66,800 | $111,200 |
| 2017 | $3,603 | $178,000 | $66,800 | $111,200 |
| 2016 | $3,603 | $178,000 | $66,800 | $111,200 |
| 2015 | $3,202 | $154,300 | $54,500 | $99,800 |
| 2014 | $3,095 | $154,300 | $54,500 | $99,800 |
| 2013 | $3,054 | $154,300 | $54,500 | $99,800 |
Source: Public Records
Map
Nearby Homes
- 188 Wood St
- 81 Pinehurst Ave
- 79 Pinehurst Ave
- 75 Northup St
- 0 Sea View Dr
- 176 Canfield Ave
- 71 Pinehurst Ave
- 73 Pinehurst Ave
- 165 Canfield Ave
- 31 Oakhurst Ave
- 107 Coburn St
- 165 Haswill St
- 201 Hollis Ave
- 83 Ottawa Ave
- 357 Pequot Ave
- 52 Uncas St
- 72 Hollis Ave
- 9 Kenneth Ave
- 90 Huron St
- 151 Wethersfield Dr
- 193 Northup St
- 96 Sea View Dr
- 106 Seaview Dr
- 92 Sea View Dr
- 187 Northup St
- 290 Pinehurst Ave
- 184 Pinehurst Ave
- 183 Northup St
- 116 Sea View Dr
- 186 Northup St
- 177 Northup St
- 176 Pinehurst Ave
- 122 Sea View Dr
- 180 Northup St
- 85 Sea View Dr
- 78 Sea View Dr
- 185 Pinehurst Ave
- 84 Sea View Dr
- 68 Sea View Dr
- 167 Northup St
Your Personal Tour Guide
Ask me questions while you tour the home.