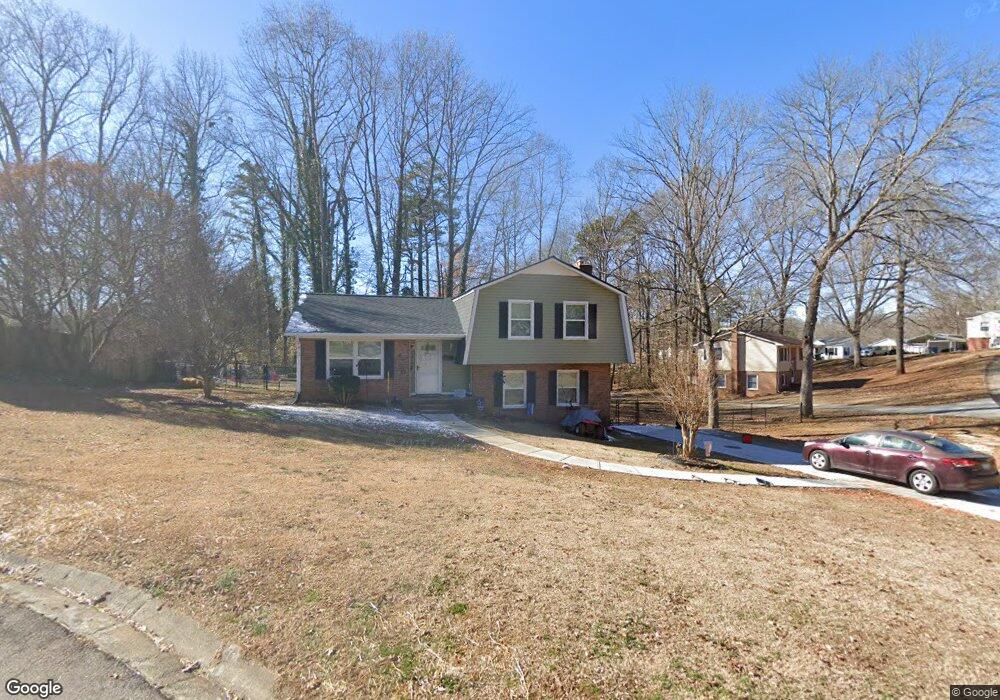
102 Sharonview St Fort Mill, SC 29715
Estimated Value: $320,000 - $390,000
--
Bed
--
Bath
1,568
Sq Ft
$229/Sq Ft
Est. Value
About This Home
This home is located at 102 Sharonview St, Fort Mill, SC 29715 and is currently estimated at $358,926, approximately $228 per square foot. 102 Sharonview St is a home located in York County with nearby schools including Riverview Elementary School, Banks Trail Middle School, and Catawba Ridge High School.
Ownership History
Date
Name
Owned For
Owner Type
Purchase Details
Closed on
Jul 30, 2019
Sold by
Faucett Stanley Dewayne
Bought by
Faucett Tanya Mellisa
Current Estimated Value
Purchase Details
Closed on
May 15, 2006
Sold by
Imler & Associates Llc
Bought by
Faucett Tanya Mellisa and Faucett Stanley Dewayne
Home Financials for this Owner
Home Financials are based on the most recent Mortgage that was taken out on this home.
Original Mortgage
$127,250
Outstanding Balance
$85,315
Interest Rate
9.34%
Mortgage Type
Adjustable Rate Mortgage/ARM
Estimated Equity
$273,611
Purchase Details
Closed on
May 18, 2004
Sold by
Imler Patti J
Bought by
Imler & Associates Llc
Purchase Details
Closed on
Apr 23, 2004
Sold by
Fannie Mae
Bought by
Imler Patti J
Purchase Details
Closed on
Oct 22, 2003
Sold by
Heid Peggy R
Bought by
Federal National Mortgage Association
Create a Home Valuation Report for This Property
The Home Valuation Report is an in-depth analysis detailing your home's value as well as a comparison with similar homes in the area
Home Values in the Area
Average Home Value in this Area
Purchase History
| Date | Buyer | Sale Price | Title Company |
|---|---|---|---|
| Faucett Tanya Mellisa | -- | None Available | |
| Faucett Tanya Mellisa | $127,500 | None Available | |
| Imler & Associates Llc | -- | -- | |
| Imler Patti J | -- | -- | |
| Federal National Mortgage Association | $50,000 | -- |
Source: Public Records
Mortgage History
| Date | Status | Borrower | Loan Amount |
|---|---|---|---|
| Open | Faucett Tanya Mellisa | $127,250 |
Source: Public Records
Tax History Compared to Growth
Tax History
| Year | Tax Paid | Tax Assessment Tax Assessment Total Assessment is a certain percentage of the fair market value that is determined by local assessors to be the total taxable value of land and additions on the property. | Land | Improvement |
|---|---|---|---|---|
| 2024 | $1,480 | $5,876 | $1,800 | $4,076 |
| 2023 | $1,448 | $5,876 | $1,800 | $4,076 |
| 2022 | $1,407 | $5,878 | $1,800 | $4,078 |
| 2021 | -- | $5,878 | $1,800 | $4,078 |
| 2020 | $4,217 | $8,817 | $0 | $0 |
| 2019 | $1,307 | $6,750 | $0 | $0 |
| 2018 | $1,364 | $4,500 | $0 | $0 |
| 2017 | $1,313 | $4,500 | $0 | $0 |
| 2016 | $1,309 | $4,500 | $0 | $0 |
| 2014 | $1,054 | $4,500 | $1,600 | $2,900 |
| 2013 | $1,054 | $4,900 | $1,800 | $3,100 |
Source: Public Records
Map
Nearby Homes
- 1047 Honeybee Trail
- LOT 64B Peachtree Ln
- 113 Dogwood Ln
- 305 Park Dr
- 122 Leonidas St
- 105 Lyman Oak Ct
- 139 Creekside Dr
- 310 Sidney Johnson St
- 304 Jackson St
- 203 Jackson St
- Dover Plan at Elizabeth - Meadows
- Westbury Plan at Elizabeth - Walk
- Sweetbay Plan at Elizabeth - Walk
- Crestwind Plan at Elizabeth - Walk
- Hunter Basement Plan at Elizabeth - Enclave
- Bradford Plan at Elizabeth - Walk
- Granville Plan at Elizabeth - Enclave
- Chiffon Plan at Elizabeth - Orchards
- Dorchester Plan at Elizabeth - Meadows
- Grisham Basement Plan at Elizabeth - Enclave
- 100 Sharonview St
- 104 Sharonview St
- 103 Yorktowne St
- 106 Sharonview St Unit 29
- 105 Yorktowne St
- 101 Sharonview St
- 108 Sharonview St
- 103 Sharonview St
- 101 Yorktowne St
- 207 Myers St
- 107 Yorktowne St
- 216 Myers St
- 214 Myers St
- 110 Sharonview St
- 212 Myers St
- 1092 Honeybee Trail
- 105 Sharonview St
- 1102 Honeybee Trail
- 210 Myers St
- 109 Yorktowne St