Estimated Value: $52,000 - $78,000
3
Beds
1
Bath
1,190
Sq Ft
$58/Sq Ft
Est. Value
About This Home
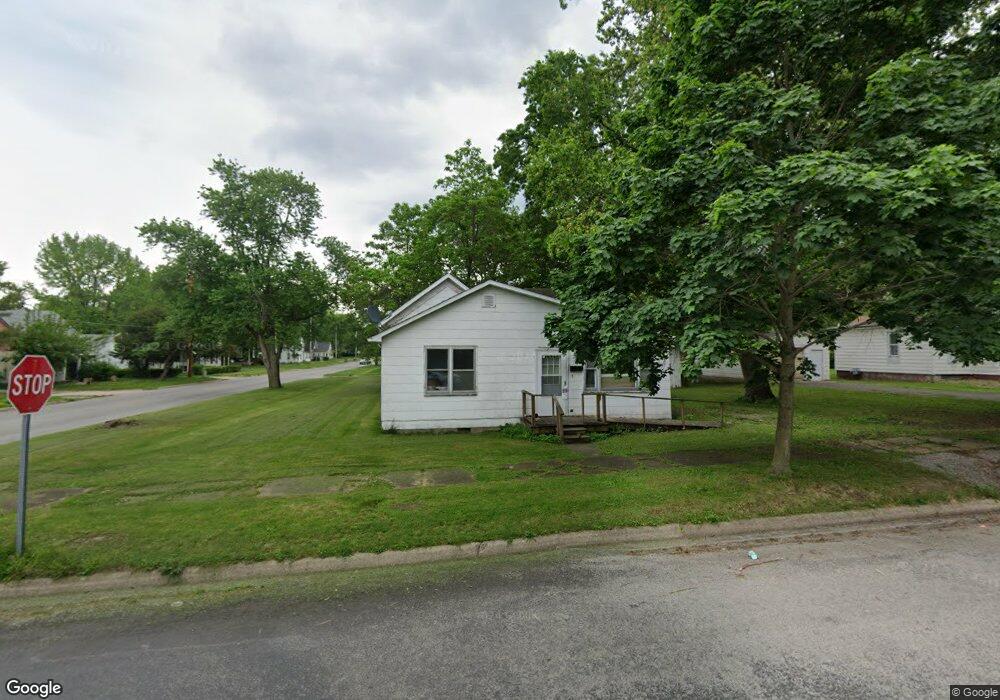
This home is located at 102 Sherman St, Pana, IL 62557 and is currently estimated at $69,346, approximately $58 per square foot. 102 Sherman St is a home located in Christian County with nearby schools including Washington Elementary School, Lincoln Elementary School, and Pana Jr High School.
Ownership History
Date
Name
Owned For
Owner Type
Purchase Details
Closed on
Jan 24, 2022
Sold by
Jones Julie M and Jones Manuel Julie
Bought by
Eiler James and Eiler Audrey L
Current Estimated Value
Purchase Details
Closed on
Apr 5, 2011
Sold by
Eiler James N and Estate Of Lois Evelyn Eiler
Bought by
Manuel Julie M
Home Financials for this Owner
Home Financials are based on the most recent Mortgage that was taken out on this home.
Original Mortgage
$34,404
Interest Rate
4.99%
Mortgage Type
New Conventional
Create a Home Valuation Report for This Property
The Home Valuation Report is an in-depth analysis detailing your home's value as well as a comparison with similar homes in the area
Home Values in the Area
Average Home Value in this Area
Purchase History
| Date | Buyer | Sale Price | Title Company |
|---|---|---|---|
| Eiler James | $26,000 | -- | |
| Manuel Julie M | $30,000 | None Available |
Source: Public Records
Mortgage History
| Date | Status | Borrower | Loan Amount |
|---|---|---|---|
| Previous Owner | Manuel Julie M | $34,404 |
Source: Public Records
Tax History Compared to Growth
Tax History
| Year | Tax Paid | Tax Assessment Tax Assessment Total Assessment is a certain percentage of the fair market value that is determined by local assessors to be the total taxable value of land and additions on the property. | Land | Improvement |
|---|---|---|---|---|
| 2024 | $1,107 | $11,396 | $3,419 | $7,977 |
| 2023 | $1,063 | $10,767 | $3,230 | $7,537 |
| 2022 | $1,036 | $10,094 | $3,208 | $6,886 |
| 2021 | $399 | $9,896 | $3,145 | $6,751 |
| 2020 | $362 | $9,477 | $3,012 | $6,465 |
| 2019 | $379 | $9,700 | $3,083 | $6,617 |
| 2018 | $355 | $9,479 | $3,012 | $6,467 |
| 2017 | $369 | $9,672 | $3,073 | $6,599 |
| 2016 | $364 | $9,645 | $3,064 | $6,581 |
| 2015 | $356 | $9,534 | $3,029 | $6,505 |
| 2014 | $317 | $8,867 | $2,817 | $6,050 |
| 2013 | $318 | $8,866 | $2,816 | $6,050 |
| 2011 | $455 | $9,076 | $2,883 | $6,193 |
Source: Public Records
Map
Nearby Homes