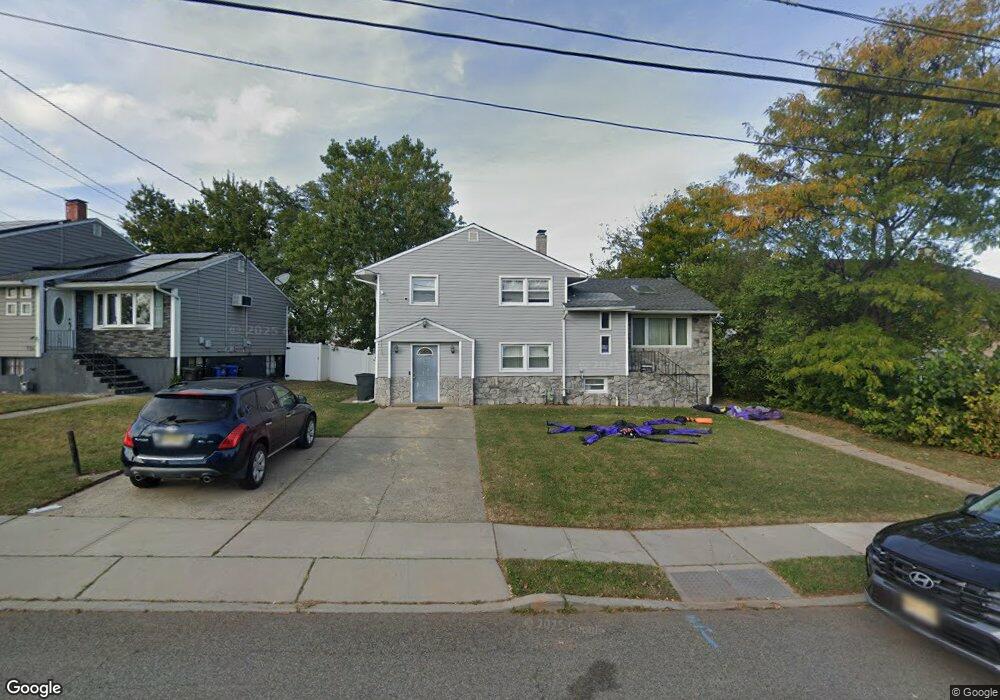
102 Sycamore St Carteret, NJ 07008
Estimated Value: $567,941 - $660,000
4
Beds
2
Baths
1,802
Sq Ft
$343/Sq Ft
Est. Value
About This Home
This home is located at 102 Sycamore St, Carteret, NJ 07008 and is currently estimated at $617,735, approximately $342 per square foot. 102 Sycamore St is a home located in Middlesex County with nearby schools including Carteret High School and St Joseph School.
Ownership History
Date
Name
Owned For
Owner Type
Purchase Details
Closed on
Jun 13, 2017
Sold by
Bas Bagdasar B
Bought by
Mccall Ila K and Mccall Debbie
Current Estimated Value
Home Financials for this Owner
Home Financials are based on the most recent Mortgage that was taken out on this home.
Original Mortgage
$368,207
Outstanding Balance
$301,809
Interest Rate
3.5%
Mortgage Type
FHA
Estimated Equity
$315,926
Purchase Details
Closed on
Nov 1, 2016
Sold by
Nancoo Don Michael and Nancoo Geraldine
Bought by
Bas Bagdsar B
Purchase Details
Closed on
Jun 10, 2002
Purchase Details
Closed on
Jun 15, 2001
Sold by
Derosa John
Bought by
Nancoo Don
Home Financials for this Owner
Home Financials are based on the most recent Mortgage that was taken out on this home.
Original Mortgage
$182,100
Interest Rate
7.21%
Mortgage Type
FHA
Purchase Details
Closed on
Apr 27, 1995
Sold by
Francke Edward
Bought by
Derosa John and Derosa Astrid
Create a Home Valuation Report for This Property
The Home Valuation Report is an in-depth analysis detailing your home's value as well as a comparison with similar homes in the area
Home Values in the Area
Average Home Value in this Area
Purchase History
| Date | Buyer | Sale Price | Title Company |
|---|---|---|---|
| Mccall Ila K | $375,000 | Foundation Title Llc | |
| Bas Bagdsar B | $165,000 | Multiple | |
| -- | -- | -- | |
| Nancoo Don | $185,000 | -- | |
| Derosa John | $142,000 | -- |
Source: Public Records
Mortgage History
| Date | Status | Borrower | Loan Amount |
|---|---|---|---|
| Open | Mccall Ila K | $368,207 | |
| Previous Owner | Nancoo Don | $182,100 |
Source: Public Records
Tax History Compared to Growth
Tax History
| Year | Tax Paid | Tax Assessment Tax Assessment Total Assessment is a certain percentage of the fair market value that is determined by local assessors to be the total taxable value of land and additions on the property. | Land | Improvement |
|---|---|---|---|---|
| 2025 | $8,091 | $586,500 | $360,700 | $225,800 |
| 2024 | $7,883 | $253,800 | $131,500 | $122,300 |
| 2023 | $7,883 | $253,800 | $131,500 | $122,300 |
| 2022 | $7,665 | $253,800 | $131,500 | $122,300 |
| 2021 | $5,617 | $253,800 | $131,500 | $122,300 |
| 2020 | $7,299 | $253,800 | $131,500 | $122,300 |
| 2019 | $7,089 | $253,800 | $131,500 | $122,300 |
| 2018 | $6,921 | $253,800 | $131,500 | $122,300 |
| 2017 | $6,675 | $253,800 | $131,500 | $122,300 |
| 2016 | $7,430 | $234,600 | $96,500 | $138,100 |
| 2015 | $7,322 | $234,600 | $96,500 | $138,100 |
| 2014 | $7,003 | $234,600 | $96,500 | $138,100 |
Source: Public Records
Map
Nearby Homes