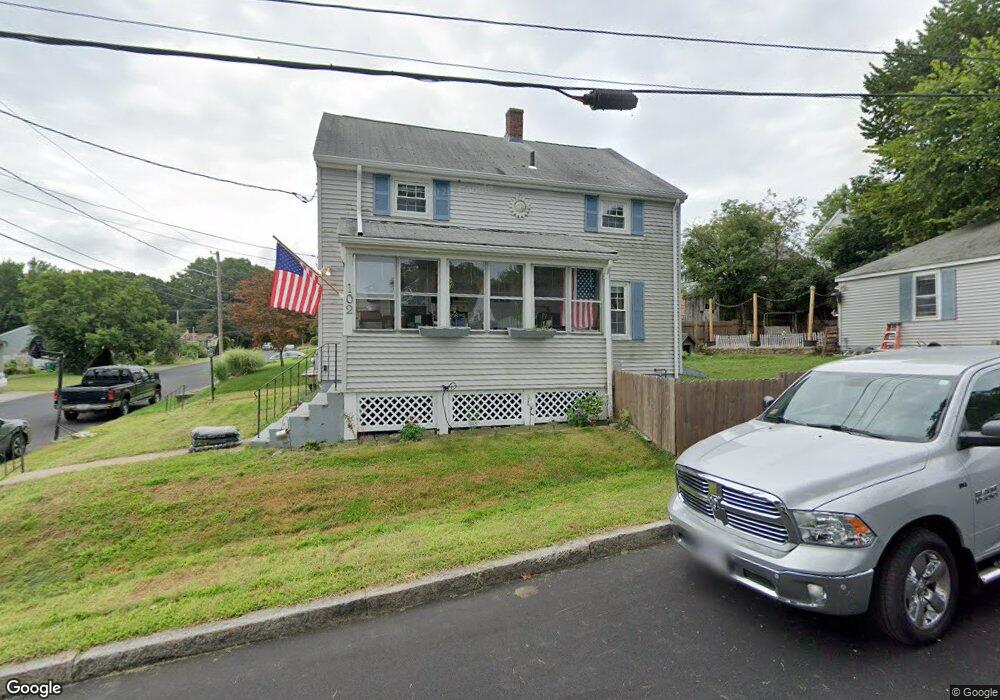
102 Sycamore St Woonsocket, RI 02895
Fairmount NeighborhoodEstimated Value: $357,000 - $398,000
4
Beds
2
Baths
1,381
Sq Ft
$271/Sq Ft
Est. Value
About This Home
This home is located at 102 Sycamore St, Woonsocket, RI 02895 and is currently estimated at $374,499, approximately $271 per square foot. 102 Sycamore St is a home located in Providence County with nearby schools including Woonsocket High School, Rise Prep Mayoral Academy Middle School, and Rise Prep Mayoral Academy.
Ownership History
Date
Name
Owned For
Owner Type
Purchase Details
Closed on
May 4, 2017
Sold by
Tetreault David and Tetreault Allyson
Bought by
Whelan Randall
Current Estimated Value
Home Financials for this Owner
Home Financials are based on the most recent Mortgage that was taken out on this home.
Original Mortgage
$173,000
Outstanding Balance
$140,448
Interest Rate
4.23%
Mortgage Type
VA
Estimated Equity
$234,051
Purchase Details
Closed on
Jan 26, 2009
Sold by
Lasalle Bank Na
Bought by
Tetreault David and Tetreault Allyson
Purchase Details
Closed on
Dec 2, 2008
Sold by
Allaire John and Lasalle Bk
Bought by
Lasalle Bk
Purchase Details
Closed on
Oct 10, 2006
Sold by
Deutsche Bk
Bought by
Allaire John and Allaire Allison K
Purchase Details
Closed on
Sep 29, 2004
Sold by
Cox Christopher and Cox Yvette
Bought by
Wolfe Donald
Purchase Details
Closed on
Jul 2, 2001
Sold by
Liard James
Bought by
Cox Christopher and Cox Yvette
Purchase Details
Closed on
Jul 18, 1997
Sold by
Liard James and Liard Jeannette
Bought by
Liard James
Create a Home Valuation Report for This Property
The Home Valuation Report is an in-depth analysis detailing your home's value as well as a comparison with similar homes in the area
Home Values in the Area
Average Home Value in this Area
Purchase History
| Date | Buyer | Sale Price | Title Company |
|---|---|---|---|
| Whelan Randall | $173,000 | -- | |
| Tetreault David | $140,000 | -- | |
| Lasalle Bk | $167,598 | -- | |
| Allaire John | $224,000 | -- | |
| Wolfe Donald | $239,000 | -- | |
| Cox Christopher | $148,500 | -- | |
| Liard James | $80,000 | -- | |
| Whelan Randall P | $173,000 | -- | |
| Lasalle Bk | $167,598 | -- | |
| Allaire John P | $224,000 | -- | |
| Wolfe Donald W | $239,000 | -- | |
| Cox Christopher | $148,500 | -- | |
| Liard James M | $80,000 | -- |
Source: Public Records
Mortgage History
| Date | Status | Borrower | Loan Amount |
|---|---|---|---|
| Open | Whelan Randall | $173,000 | |
| Closed | Liard James M | $173,000 |
Source: Public Records
Tax History
| Year | Tax Paid | Tax Assessment Tax Assessment Total Assessment is a certain percentage of the fair market value that is determined by local assessors to be the total taxable value of land and additions on the property. | Land | Improvement |
|---|---|---|---|---|
| 2025 | $3,869 | $344,500 | $95,400 | $249,100 |
| 2024 | $3,644 | $250,600 | $90,600 | $160,000 |
| 2023 | $3,503 | $250,600 | $90,600 | $160,000 |
| 2022 | $3,503 | $250,600 | $90,600 | $160,000 |
| 2021 | $3,800 | $160,000 | $58,100 | $101,900 |
| 2020 | $3,840 | $160,000 | $58,100 | $101,900 |
| 2018 | $3,853 | $160,000 | $58,100 | $101,900 |
| 2017 | $4,045 | $134,400 | $53,300 | $81,100 |
| 2016 | $4,279 | $134,400 | $53,300 | $81,100 |
| 2015 | $4,916 | $134,400 | $53,300 | $81,100 |
| 2014 | -- | $131,500 | $58,700 | $72,800 |
Source: Public Records
Map
Nearby Homes
- 29 Graves Ave
- 217 4th Ave
- 81 Fountain St
- 60 Fairlawn Ave
- 123 4th Ave
- 0 10th Ave
- 10 10th Ave
- 52 Mendon Rd
- 36 Fairmount St
- 84 Saint Paul St
- 83 4th Ave
- 10 Huntington Ave
- 154 156 Winter St
- 0 Mendon Rd Unit 1406977
- 11 Federal St
- 12 Market St
- 76 Main St
- 164 W School St
- 122 Canal St
- 0 Holbrook Ln Unit 1402850
- 66 Cherry Hill Ave
- 128 Sycamore St
- 639 6th Ave
- 633 6th Ave
- 109 Sycamore St
- 76 Sycamore St
- 125 Sycamore St
- 48 Cherry Hill Ave
- 61 Cherry Hill Ave
- 79 Sycamore St
- 621 6th Ave
- 36 Cherry Hill Ave
- 609 6th Ave
- 45 Cherry Hill Ave
- 57 Sycamore St
- 125 Cherry Hill Ave
- 1 Sycamore St
- 0 Cherry Hill Ave
- 26 Cherry Hill Ave
- 132 Cherry Hill Ave
Your Personal Tour Guide
Ask me questions while you tour the home.