102 Truman Ln Texarkana, TX 75501
Estimated Value: $108,649 - $147,000
--
Bed
--
Bath
1,226
Sq Ft
$102/Sq Ft
Est. Value
About This Home
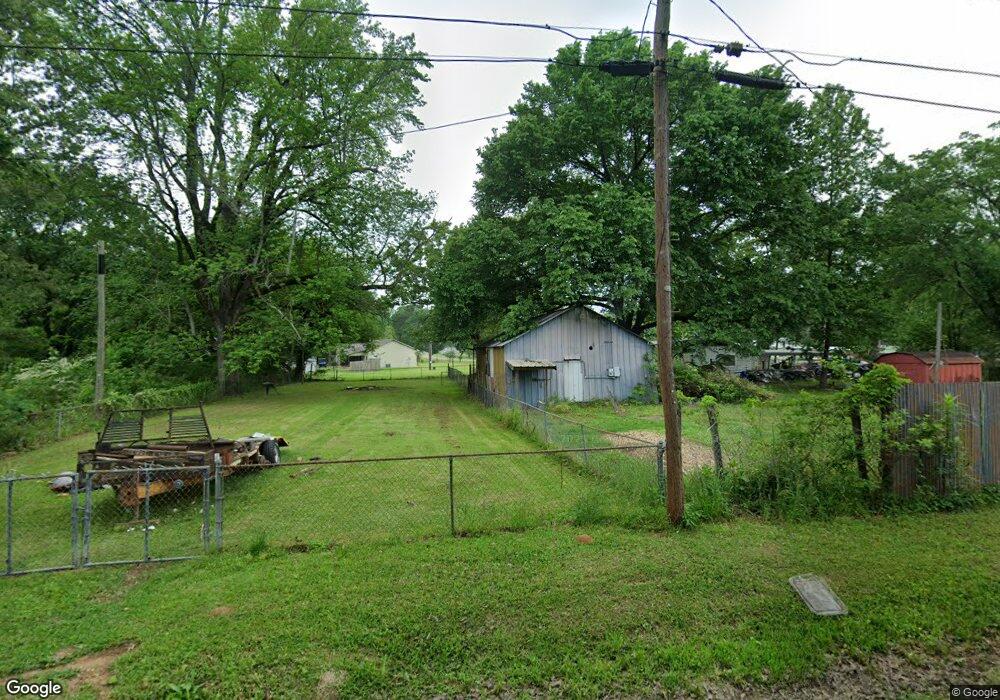
This home is located at 102 Truman Ln, Texarkana, TX 75501 and is currently estimated at $124,662, approximately $101 per square foot. 102 Truman Ln is a home located in Bowie County with nearby schools including Liberty-Eylau Early Childhood Center, Liberty-Eylau Primary School, and Liberty-Eylau C.K. Bender Elementary Campus.
Create a Home Valuation Report for This Property
The Home Valuation Report is an in-depth analysis detailing your home's value as well as a comparison with similar homes in the area
Home Values in the Area
Average Home Value in this Area
Tax History Compared to Growth
Tax History
| Year | Tax Paid | Tax Assessment Tax Assessment Total Assessment is a certain percentage of the fair market value that is determined by local assessors to be the total taxable value of land and additions on the property. | Land | Improvement |
|---|---|---|---|---|
| 2025 | $838 | $58,442 | $12,500 | $45,942 |
| 2024 | $838 | $56,744 | $12,500 | $44,244 |
| 2023 | $801 | $53,601 | $12,500 | $41,101 |
| 2022 | $796 | $46,180 | $7,500 | $38,680 |
| 2021 | $720 | $39,325 | $7,500 | $31,825 |
| 2020 | $652 | $35,344 | $7,500 | $27,844 |
| 2019 | $672 | $34,571 | $7,500 | $27,071 |
| 2018 | $657 | $33,822 | $7,500 | $26,322 |
| 2017 | $684 | $35,332 | $7,500 | $27,832 |
| 2016 | $684 | $35,332 | $7,500 | $27,832 |
| 2015 | $680 | $35,332 | $7,500 | $27,832 |
| 2014 | $680 | $36,381 | $10,000 | $26,381 |
Source: Public Records
Map
Nearby Homes
- 115 Geneva St
- TBD County Road 1304
- 86 Piney Grove Cir
- 694 Fomby Ln
- 675 Macedonia Rd
- 830 Kelly Rd
- 71 Macedonia Rd Unit 71 Macedonia RD
- 105 Eastline Rd
- 201 Pine Forest St
- 206 Pine Forest St
- 901 Conway Dr
- 107 Lampasas Way
- 107 Berry Dr
- 416 W Greenfield Dr
- 225 Pebble Creek Cir
- 244 Hickerson Ave
- 310 W Greenfield Dr
- 216 W Pioneer St
- 206 Redwater Rd
- 295 Terry St