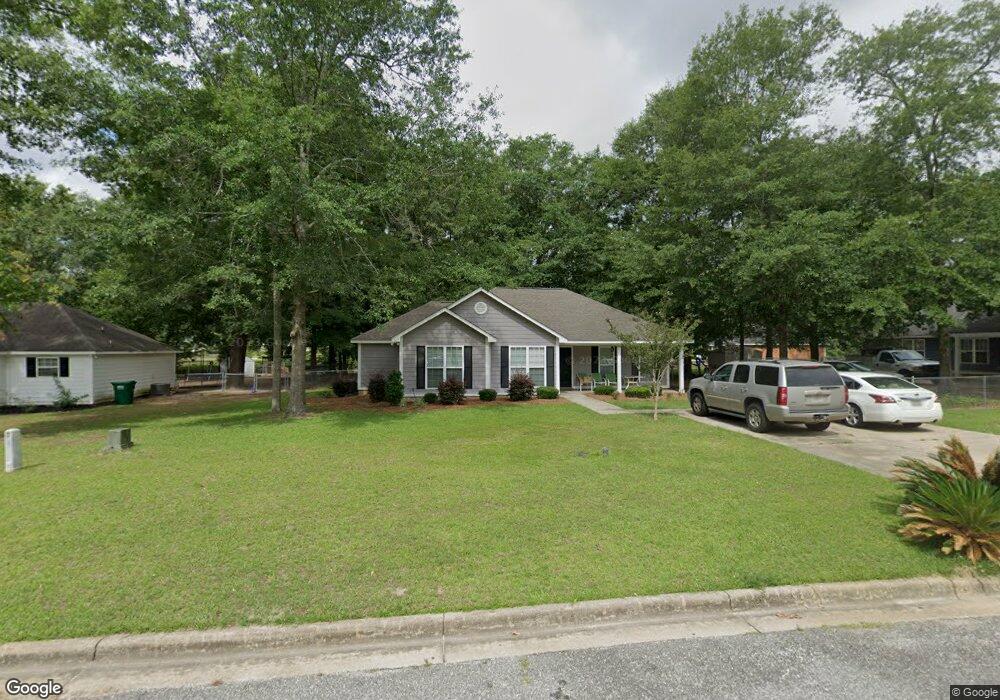
102 Vogel Ct Leesburg, GA 31763
Estimated Value: $166,000 - $203,000
3
Beds
2
Baths
1,460
Sq Ft
$128/Sq Ft
Est. Value
About This Home
This home is located at 102 Vogel Ct, Leesburg, GA 31763 and is currently estimated at $187,523, approximately $128 per square foot. 102 Vogel Ct is a home located in Lee County with nearby schools including Kinchafoonee Primary School, Twin Oaks Elementary School, and Lee County Middle School East.
Ownership History
Date
Name
Owned For
Owner Type
Purchase Details
Closed on
Apr 18, 2022
Sold by
Collins Jimmy E
Bought by
Tommy A & Annie R Jowers Family Partners
Current Estimated Value
Purchase Details
Closed on
Jun 30, 2016
Sold by
Federal National Mortgage Association
Bought by
Collins Jimmy E
Purchase Details
Closed on
Feb 9, 2016
Sold by
Ditech Financial Llc
Bought by
Federal National Mtg Associati
Purchase Details
Closed on
Jan 5, 2016
Sold by
Brinson Michael K
Bought by
Ditech Financial Llc
Purchase Details
Closed on
May 9, 2006
Sold by
Houng Joosun
Bought by
Brinson Michael K
Home Financials for this Owner
Home Financials are based on the most recent Mortgage that was taken out on this home.
Original Mortgage
$111,550
Interest Rate
6.41%
Mortgage Type
New Conventional
Purchase Details
Closed on
Aug 1, 2004
Sold by
Martin Russell E
Bought by
Hong Joosun
Purchase Details
Closed on
Dec 1, 2003
Sold by
B & W Enterprises
Bought by
Martin Russell E
Create a Home Valuation Report for This Property
The Home Valuation Report is an in-depth analysis detailing your home's value as well as a comparison with similar homes in the area
Home Values in the Area
Average Home Value in this Area
Purchase History
| Date | Buyer | Sale Price | Title Company |
|---|---|---|---|
| Tommy A & Annie R Jowers Family Partners | $125,000 | -- | |
| Collins Jimmy E | $88,900 | -- | |
| Federal National Mtg Associati | $99,700 | -- | |
| Ditech Financial Llc | $99,700 | -- | |
| Brinson Michael K | $115,000 | -- | |
| Hong Joosun | $104,000 | -- | |
| Martin Russell E | $114,000 | -- |
Source: Public Records
Mortgage History
| Date | Status | Borrower | Loan Amount |
|---|---|---|---|
| Previous Owner | Brinson Michael K | $111,550 |
Source: Public Records
Tax History Compared to Growth
Tax History
| Year | Tax Paid | Tax Assessment Tax Assessment Total Assessment is a certain percentage of the fair market value that is determined by local assessors to be the total taxable value of land and additions on the property. | Land | Improvement |
|---|---|---|---|---|
| 2024 | $1,925 | $55,200 | $8,000 | $47,200 |
| 2023 | $1,642 | $55,200 | $8,000 | $47,200 |
| 2022 | $1,555 | $55,200 | $8,000 | $47,200 |
| 2021 | $1,858 | $55,200 | $8,000 | $47,200 |
| 2020 | $1,426 | $43,080 | $9,000 | $34,080 |
| 2019 | $1,451 | $43,080 | $9,000 | $34,080 |
| 2018 | $1,452 | $43,080 | $9,000 | $34,080 |
| 2017 | $1,135 | $43,080 | $9,000 | $34,080 |
| 2016 | $1,312 | $43,080 | $9,000 | $34,080 |
| 2015 | $1,319 | $43,080 | $9,000 | $34,080 |
| 2014 | $1,324 | $43,080 | $9,000 | $34,080 |
| 2013 | -- | $43,080 | $9,000 | $34,080 |
Source: Public Records
Map
Nearby Homes
- 258 Fire Tower Rd
- 201 Groover St
- 102 Sautee Ct
- 102 Society St
- 182 Canal St
- 178 Old Stage Rd
- 1564 State Hwy 32w
- 1591 E US Hwy 32
- 134 Brookfair Ln
- 154 Morgan Farm Rd
- 143 Tallassee Trail
- 105 Fortner Ct
- 249 Morgan Farm Dr
- 134 Danville Dr
- 118 Blue Springs Dr
- 98 Senah Dr
- 152 Senah Dr
- 159 Senah Dr
- 163 Northwood Dr
- 127 Northwood Dr
- 104 Vogel Ct
- 121 Amicolola Ct
- 127 Amicolola Ct
- 123 Nacoochee Dr
- 106 Vogel Ct
- 119 Nacoochee Dr
- 113 Amicolola Ct
- 103 Vogel Ct
- 105 Vogel Ct
- 127 Nacoochee Dr
- 115 Nacoochee Dr
- 108 Vogel Ct
- 107 Amicalola Ct
- 107 Amicolola Ct
- 128 Amicolola Ct
- 107 Vogel Ct
- 131 Nacoochee Dr
- 120 Amicolola Ct
- 124 Amicolola Ct
- 111 Nacoochee Dr