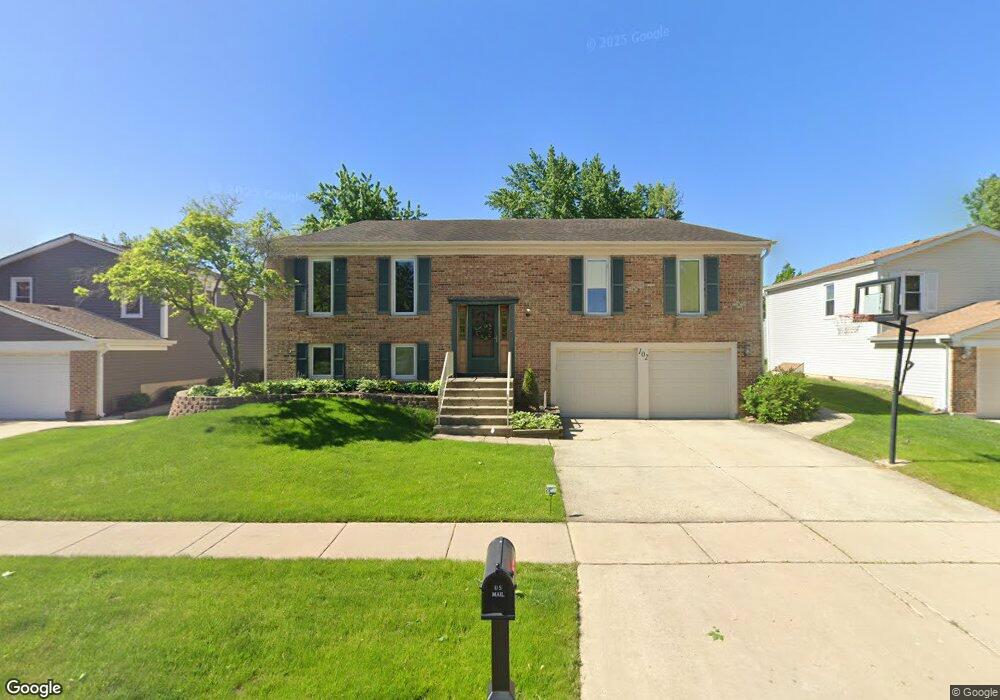
102 W End Rd Roselle, IL 60172
Estimated Value: $413,613 - $518,000
3
Beds
2
Baths
1,987
Sq Ft
$228/Sq Ft
Est. Value
About This Home
This home is located at 102 W End Rd, Roselle, IL 60172 and is currently estimated at $452,653, approximately $227 per square foot. 102 W End Rd is a home located in DuPage County with nearby schools including Spring Hills Elementary School, Roselle Middle School, and Lake Park High School.
Ownership History
Date
Name
Owned For
Owner Type
Purchase Details
Closed on
May 29, 2002
Sold by
Jastper Thomas A
Bought by
Walsh Grady D and Walsh Barbara M
Current Estimated Value
Home Financials for this Owner
Home Financials are based on the most recent Mortgage that was taken out on this home.
Original Mortgage
$195,920
Outstanding Balance
$82,898
Interest Rate
6.82%
Estimated Equity
$369,755
Purchase Details
Closed on
Nov 20, 2001
Sold by
Jastper Cheryl C and Carrao Cheryl C
Bought by
Jastper Thomas A
Home Financials for this Owner
Home Financials are based on the most recent Mortgage that was taken out on this home.
Original Mortgage
$203,609
Interest Rate
6.6%
Mortgage Type
FHA
Purchase Details
Closed on
Sep 6, 1996
Sold by
Vitucci Frank M and Vitucci Lisa M
Bought by
Jastper Thomas A and Carrao Cheryl C
Home Financials for this Owner
Home Financials are based on the most recent Mortgage that was taken out on this home.
Original Mortgage
$159,900
Interest Rate
8.29%
Create a Home Valuation Report for This Property
The Home Valuation Report is an in-depth analysis detailing your home's value as well as a comparison with similar homes in the area
Home Values in the Area
Average Home Value in this Area
Purchase History
| Date | Buyer | Sale Price | Title Company |
|---|---|---|---|
| Walsh Grady D | $245,000 | -- | |
| Jastper Thomas A | -- | -- | |
| Jastper Thomas A | $170,000 | Attorneys Title Guaranty Fun |
Source: Public Records
Mortgage History
| Date | Status | Borrower | Loan Amount |
|---|---|---|---|
| Open | Walsh Grady D | $195,920 | |
| Previous Owner | Jastper Thomas A | $203,609 | |
| Previous Owner | Jastper Thomas A | $159,900 | |
| Closed | Walsh Grady D | $36,735 |
Source: Public Records
Tax History
| Year | Tax Paid | Tax Assessment Tax Assessment Total Assessment is a certain percentage of the fair market value that is determined by local assessors to be the total taxable value of land and additions on the property. | Land | Improvement |
|---|---|---|---|---|
| 2024 | $8,747 | $124,396 | $40,645 | $83,751 |
| 2023 | $8,089 | $113,760 | $37,170 | $76,590 |
| 2022 | $7,874 | $110,470 | $36,930 | $73,540 |
| 2021 | $7,535 | $104,960 | $35,090 | $69,870 |
| 2020 | $7,571 | $102,400 | $34,230 | $68,170 |
| 2019 | $7,353 | $98,400 | $32,890 | $65,510 |
| 2018 | $6,674 | $89,800 | $30,020 | $59,780 |
| 2017 | $6,404 | $83,230 | $27,820 | $55,410 |
| 2016 | $6,170 | $77,030 | $25,750 | $51,280 |
| 2015 | $5,565 | $71,880 | $24,030 | $47,850 |
| 2014 | $5,314 | $68,260 | $22,820 | $45,440 |
| 2013 | $5,269 | $70,590 | $23,600 | $46,990 |
Source: Public Records
Map
Nearby Homes
- 24W330 Central Ave
- 760 Longford Dr
- 460 W Irving Park Rd
- 24W737 Central Ave
- 960 Mensching Rd
- 100 N Bokelman St Unit 329
- 50 N Bokelman St Unit 234
- 390 S Garden Ave
- 871 Rosebud Ct
- 219 N Prospect St
- 230 Ashley Ct
- 682 Daisy Ln Unit 213
- 1705 Seward St
- 143 Sussex Ct Unit 13653
- 107 Carmela Ct
- 550 Lake St
- 455 E Granville Ave
- 1630 Myrtle Park St
- 100 Pratt Blvd
- 1408 Welland Ct Unit 13701