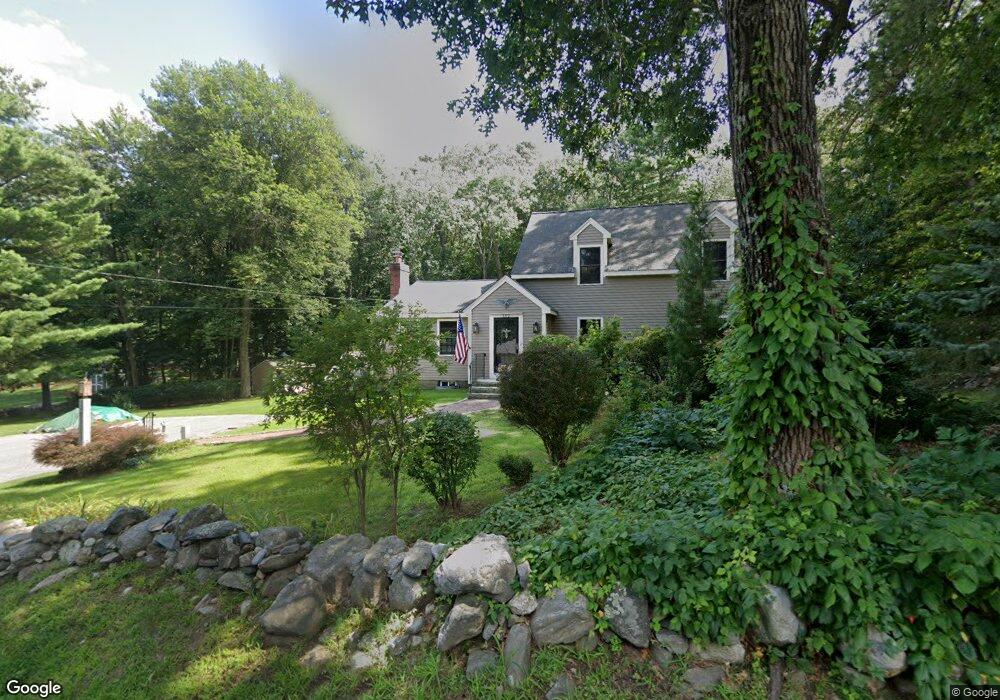
102 W Hill Rd Marlborough, MA 01752
French Hill NeighborhoodEstimated Value: $644,000 - $726,000
5
Beds
3
Baths
1,966
Sq Ft
$346/Sq Ft
Est. Value
About This Home
This home is located at 102 W Hill Rd, Marlborough, MA 01752 and is currently estimated at $679,954, approximately $345 per square foot. 102 W Hill Rd is a home located in Middlesex County with nearby schools including Marlborough High School, New Covenant Christian School, and First Steps Children's Center.
Ownership History
Date
Name
Owned For
Owner Type
Purchase Details
Closed on
Jan 14, 1999
Sold by
Gardiner Rita P
Bought by
Damico David A and Damico Cynthia L
Current Estimated Value
Purchase Details
Closed on
Mar 27, 1989
Sold by
Gardiner David J
Bought by
Gardiner Rita P
Home Financials for this Owner
Home Financials are based on the most recent Mortgage that was taken out on this home.
Original Mortgage
$50,000
Interest Rate
10.49%
Mortgage Type
Purchase Money Mortgage
Create a Home Valuation Report for This Property
The Home Valuation Report is an in-depth analysis detailing your home's value as well as a comparison with similar homes in the area
Home Values in the Area
Average Home Value in this Area
Purchase History
| Date | Buyer | Sale Price | Title Company |
|---|---|---|---|
| Damico David A | $162,500 | -- | |
| Gardiner Rita P | $30,000 | -- |
Source: Public Records
Mortgage History
| Date | Status | Borrower | Loan Amount |
|---|---|---|---|
| Open | Gardiner Rita P | $175,000 | |
| Previous Owner | Gardiner Rita P | $50,000 |
Source: Public Records
Tax History Compared to Growth
Tax History
| Year | Tax Paid | Tax Assessment Tax Assessment Total Assessment is a certain percentage of the fair market value that is determined by local assessors to be the total taxable value of land and additions on the property. | Land | Improvement |
|---|---|---|---|---|
| 2025 | $5,571 | $565,000 | $236,900 | $328,100 |
| 2024 | $5,387 | $526,100 | $215,300 | $310,800 |
| 2023 | $5,497 | $476,300 | $186,200 | $290,100 |
| 2022 | $5,270 | $401,700 | $177,400 | $224,300 |
| 2021 | $5,292 | $383,500 | $147,800 | $235,700 |
| 2020 | $5,163 | $364,100 | $138,700 | $225,400 |
| 2019 | $5,062 | $359,800 | $137,800 | $222,000 |
| 2018 | $5,053 | $345,400 | $124,800 | $220,600 |
| 2017 | $5,178 | $338,000 | $127,500 | $210,500 |
| 2016 | $5,159 | $336,300 | $127,500 | $208,800 |
| 2015 | $5,064 | $321,300 | $132,400 | $188,900 |
Source: Public Records
Map
Nearby Homes