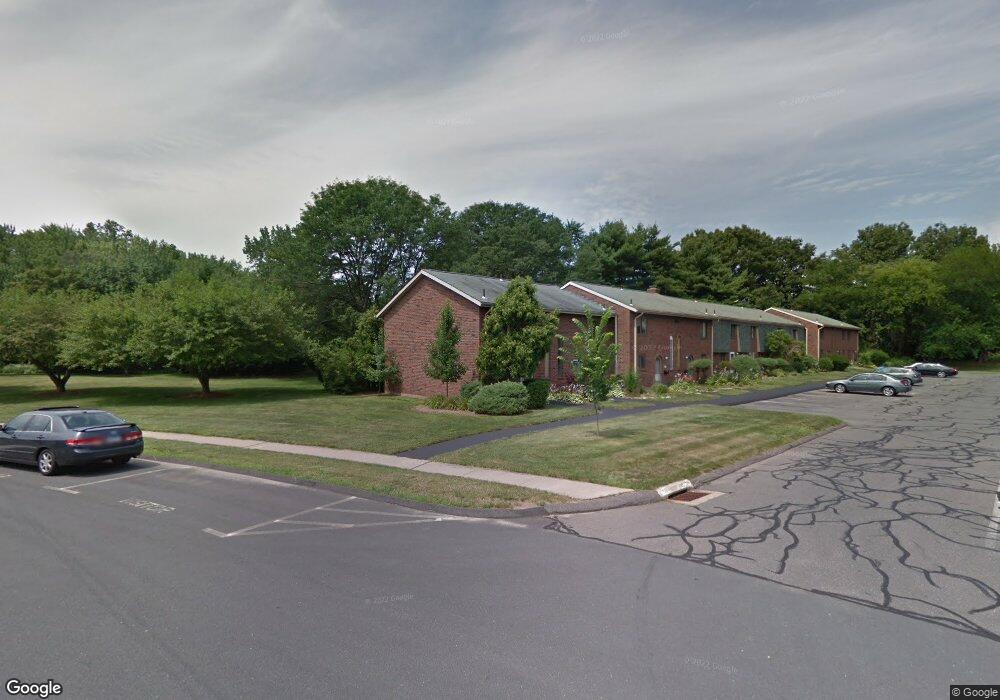
102 Wakefield Cir East Hartford, CT 06118
Estimated Value: $161,000 - $190,000
2
Beds
2
Baths
1,152
Sq Ft
$150/Sq Ft
Est. Value
About This Home
This home is located at 102 Wakefield Cir, East Hartford, CT 06118 and is currently estimated at $172,813, approximately $150 per square foot. 102 Wakefield Cir is a home located in Hartford County with nearby schools including Governor William Pitkin School, East Hartford Middle School, and East Hartford High School.
Ownership History
Date
Name
Owned For
Owner Type
Purchase Details
Closed on
Apr 30, 1998
Sold by
Gilberto Stephen P
Bought by
Gallagher Kenneth A
Current Estimated Value
Home Financials for this Owner
Home Financials are based on the most recent Mortgage that was taken out on this home.
Original Mortgage
$40,700
Outstanding Balance
$7,911
Interest Rate
7.04%
Mortgage Type
Unknown
Estimated Equity
$164,902
Purchase Details
Closed on
Jul 27, 1987
Sold by
Lezon Christine J
Bought by
Gilberto Stephen B
Home Financials for this Owner
Home Financials are based on the most recent Mortgage that was taken out on this home.
Original Mortgage
$57,000
Interest Rate
10.67%
Purchase Details
Closed on
Feb 9, 1987
Sold by
Lefebvre Elaine J
Bought by
Lezor Christine J
Home Financials for this Owner
Home Financials are based on the most recent Mortgage that was taken out on this home.
Original Mortgage
$51,000
Interest Rate
9.23%
Create a Home Valuation Report for This Property
The Home Valuation Report is an in-depth analysis detailing your home's value as well as a comparison with similar homes in the area
Home Values in the Area
Average Home Value in this Area
Purchase History
| Date | Buyer | Sale Price | Title Company |
|---|---|---|---|
| Gallagher Kenneth A | $42,000 | -- | |
| Gilberto Stephen B | $82,000 | -- | |
| Lezor Christine J | $65,000 | -- |
Source: Public Records
Mortgage History
| Date | Status | Borrower | Loan Amount |
|---|---|---|---|
| Open | Lezor Christine J | $40,700 | |
| Previous Owner | Lezor Christine J | $36,000 | |
| Previous Owner | Lezor Christine J | $57,000 | |
| Previous Owner | Lezor Christine J | $51,000 |
Source: Public Records
Tax History Compared to Growth
Tax History
| Year | Tax Paid | Tax Assessment Tax Assessment Total Assessment is a certain percentage of the fair market value that is determined by local assessors to be the total taxable value of land and additions on the property. | Land | Improvement |
|---|---|---|---|---|
| 2025 | $2,714 | $59,120 | $0 | $59,120 |
| 2024 | $2,601 | $59,120 | $0 | $59,120 |
| 2023 | $2,515 | $59,120 | $0 | $59,120 |
| 2022 | $2,424 | $59,120 | $0 | $59,120 |
| 2021 | $2,811 | $56,970 | $0 | $56,970 |
| 2020 | $2,844 | $56,970 | $0 | $56,970 |
| 2019 | $2,798 | $56,970 | $0 | $56,970 |
| 2018 | $2,715 | $56,970 | $0 | $56,970 |
| 2017 | $2,680 | $56,970 | $0 | $56,970 |
| 2016 | $2,726 | $59,440 | $0 | $59,440 |
| 2015 | $2,726 | $59,440 | $0 | $59,440 |
| 2014 | $2,699 | $59,440 | $0 | $59,440 |
Source: Public Records
Map
Nearby Homes
- 218 Wakefield Cir Unit 218
- 6 Judy Dr
- 49 Deborah Dr Unit 123
- 0 Deborah Dr Unit 115
- 0 Deborah Dr Unit 117 24077631
- 642 Silver Ln
- 42 Godar Terrace
- 122 Janet Dr
- 164 Roxbury Rd
- 50 Hilton Dr
- 77 Madison St
- 127 Ridgewood Rd
- 436 Brewer St
- 42 Patton St
- 30 Shaughnessy Dr
- 1060 Forbes St
- 441 Forest St
- 12 Carpenter Dr
- 319 Brewer St
- 115 Greenwood St
- 110 Wakefield Cir
- 108 Wakefield Cir
- 106 Wakefield Cir
- 104 Wakefield Cir
- 100 Wakefield Cir
- 98 Wakefield Cir
- 96 Wakefield Cir
- 94 Wakefield Cir
- 92 Wakefield Cir
- 90 Wakefield Cir
- 100 Wakefield Cir Unit 100
- 98 Wakefield Cir Unit 98
- 94 Wakefield Cir Unit 94
- 57 Wakefield Cir
- 57 Wakefield Cir Unit 57
- 59 Wakefield Cir
- 59 Wakefield Cir Unit 59
- 55 Wakefield Cir
- 61 Wakefield Cir
- 53 Wakefield Cir