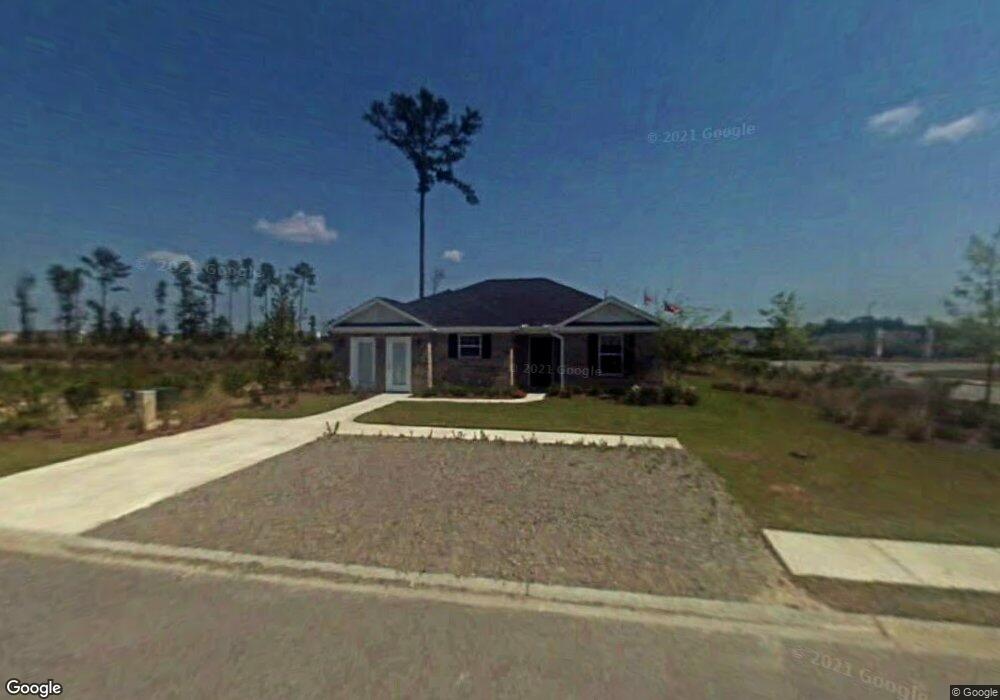
102 Waverly Way Pooler, GA 31322
Godley Station NeighborhoodEstimated Value: $285,439 - $316,000
3
Beds
2
Baths
1,335
Sq Ft
$225/Sq Ft
Est. Value
About This Home
This home is located at 102 Waverly Way, Pooler, GA 31322 and is currently estimated at $300,110, approximately $224 per square foot. 102 Waverly Way is a home located in Chatham County with nearby schools including Godley Station School, Groves High School, and Savannah Adventist Christian School.
Ownership History
Date
Name
Owned For
Owner Type
Purchase Details
Closed on
Sep 24, 2021
Sold by
Baker Joel L
Bought by
Baker Joel L and Baker Myriam
Current Estimated Value
Purchase Details
Closed on
Jul 7, 2010
Sold by
United Community Bank
Bought by
Baker Joel L
Home Financials for this Owner
Home Financials are based on the most recent Mortgage that was taken out on this home.
Original Mortgage
$112,624
Interest Rate
5.37%
Mortgage Type
FHA
Purchase Details
Closed on
Jun 1, 2010
Sold by
Genesis Designer Homes Llc
Bought by
United Community Bank
Home Financials for this Owner
Home Financials are based on the most recent Mortgage that was taken out on this home.
Original Mortgage
$112,624
Interest Rate
5.37%
Mortgage Type
FHA
Purchase Details
Closed on
Dec 28, 2005
Sold by
Not Provided
Bought by
Baker Joel L
Create a Home Valuation Report for This Property
The Home Valuation Report is an in-depth analysis detailing your home's value as well as a comparison with similar homes in the area
Home Values in the Area
Average Home Value in this Area
Purchase History
| Date | Buyer | Sale Price | Title Company |
|---|---|---|---|
| Baker Joel L | -- | -- | |
| Baker Joel L | $114,900 | -- | |
| Baker Joel L | $114,900 | -- | |
| United Community Bank | $120,000 | -- | |
| Baker Joel L | $1,470,000 | -- |
Source: Public Records
Mortgage History
| Date | Status | Borrower | Loan Amount |
|---|---|---|---|
| Previous Owner | Baker Joel L | $112,624 | |
| Previous Owner | Baker Joel L | $5,000 |
Source: Public Records
Tax History Compared to Growth
Tax History
| Year | Tax Paid | Tax Assessment Tax Assessment Total Assessment is a certain percentage of the fair market value that is determined by local assessors to be the total taxable value of land and additions on the property. | Land | Improvement |
|---|---|---|---|---|
| 2025 | $1,952 | $98,000 | $22,000 | $76,000 |
| 2024 | $1,952 | $98,280 | $22,000 | $76,280 |
| 2023 | $743 | $84,440 | $15,800 | $68,640 |
| 2022 | $905 | $77,920 | $15,800 | $62,120 |
| 2021 | $2,533 | $64,840 | $15,800 | $49,040 |
| 2020 | $1,701 | $63,360 | $15,800 | $47,560 |
| 2019 | $2,493 | $61,560 | $15,800 | $45,760 |
| 2018 | $1,728 | $62,960 | $15,800 | $47,160 |
| 2017 | $1,595 | $63,240 | $15,800 | $47,440 |
| 2016 | $1,438 | $55,600 | $8,800 | $46,800 |
| 2015 | $2,122 | $55,280 | $8,800 | $46,480 |
| 2014 | $2,339 | $47,560 | $0 | $0 |
Source: Public Records
Map
Nearby Homes
- 260 Willow Point Cir
- 126 Waverly Way
- 271 Willow Point Cir
- 105 Archwood Dr
- 13 Twin Oaks Place
- 5 Sunbriar Ln
- 75 Fairgreen St
- 30 Ashleigh Ln
- 123 Wind Willow Dr
- 75 Timber Crest Ct
- 52 Hartland Ct
- 225 Willow Point Cir
- 29 Godley Park Way
- 28 Twin Oaks Place
- 117 Westover Dr
- 12 Greatwood Way
- 15 Hawkhorn Ct
- 118 Westover Dr
- 50 Ashleigh Ln
- 34 Twin Oaks Place
- 104 Waverly Way
- 104 Waverly Way
- 106 Waverly Way
- 106 Waverly Way
- 102 Archwood Dr
- 2 Twin Oaks Place
- 102 Archwood Dr
- 108 Waverly Way
- 108 Waverly Way
- 2 Twin Oaks Place
- 0 Highlands Blvd
- 115 Waverly Way
- 104 Archwood Dr
- 4 Twin Oaks Place
- 104 Archwood Dr
- 110 Waverly Way
- 110 Waverly Way
- 117 Waverly Way
- 117 Waverly Way
- 4 Twin Oaks Place