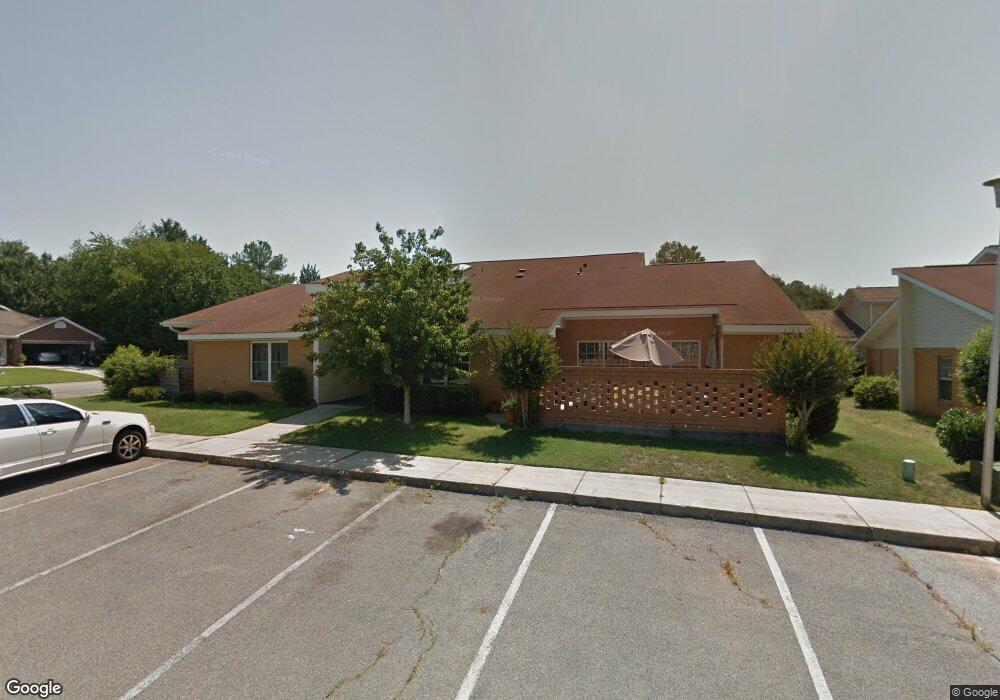
102 Westcliff Center St Unit D Warner Robins, GA 31093
Estimated Value: $140,000 - $155,000
3
Beds
2
Baths
1,608
Sq Ft
$91/Sq Ft
Est. Value
About This Home
This home is located at 102 Westcliff Center St Unit D, Warner Robins, GA 31093 and is currently estimated at $145,656, approximately $90 per square foot. 102 Westcliff Center St Unit D is a home located in Houston County with nearby schools including Westside Elementary School, Northside Middle School, and Northside High School.
Ownership History
Date
Name
Owned For
Owner Type
Purchase Details
Closed on
Jan 1, 2025
Sold by
Yellow River Lands Llc
Bought by
City 201 Llc
Current Estimated Value
Purchase Details
Closed on
Jun 25, 2019
Sold by
Meyers Ann R
Bought by
Yellow River Lands Llc
Purchase Details
Closed on
Aug 17, 2015
Sold by
Bembry Sylvia J
Bought by
Meyers Ann R
Purchase Details
Closed on
Jan 19, 2007
Sold by
Secretary Of Housing & Urban Development
Bought by
Luckett Tom E and Luckett Geraldine
Home Financials for this Owner
Home Financials are based on the most recent Mortgage that was taken out on this home.
Original Mortgage
$57,950
Interest Rate
6.08%
Mortgage Type
New Conventional
Purchase Details
Closed on
Apr 4, 2006
Sold by
Helms Anthony L and Betty A*
Bought by
Regions Bank
Purchase Details
Closed on
Nov 22, 1994
Sold by
Hardie Patrick E and Hardie Dumas J
Bought by
Collins Sandra W
Purchase Details
Closed on
Aug 10, 1978
Sold by
Westcliff Development Inc
Bought by
Hardie Patrick E and Sidney Dumas J
Create a Home Valuation Report for This Property
The Home Valuation Report is an in-depth analysis detailing your home's value as well as a comparison with similar homes in the area
Home Values in the Area
Average Home Value in this Area
Purchase History
| Date | Buyer | Sale Price | Title Company |
|---|---|---|---|
| City 201 Llc | -- | None Listed On Document | |
| Yellow River Lands Llc | $39,000 | None Available | |
| Meyers Ann R | -- | -- | |
| Luckett Tom E | -- | None Available | |
| Regions Bank | $57,500 | -- | |
| Collins Sandra W | $44,000 | -- | |
| Hardie Patrick E | $30,400 | -- |
Source: Public Records
Mortgage History
| Date | Status | Borrower | Loan Amount |
|---|---|---|---|
| Previous Owner | Luckett Tom E | $57,950 |
Source: Public Records
Tax History Compared to Growth
Tax History
| Year | Tax Paid | Tax Assessment Tax Assessment Total Assessment is a certain percentage of the fair market value that is determined by local assessors to be the total taxable value of land and additions on the property. | Land | Improvement |
|---|---|---|---|---|
| 2024 | $920 | $28,120 | $3,200 | $24,920 |
| 2023 | $890 | $27,000 | $3,200 | $23,800 |
| 2022 | $445 | $19,360 | $3,200 | $16,160 |
| 2021 | $386 | $16,680 | $3,200 | $13,480 |
| 2020 | $362 | $19,320 | $3,200 | $16,120 |
| 2019 | $402 | $19,320 | $3,200 | $16,120 |
| 2018 | $402 | $19,320 | $3,200 | $16,120 |
| 2017 | $552 | $25,720 | $3,200 | $22,520 |
| 2016 | $599 | $25,720 | $3,200 | $22,520 |
| 2015 | -- | $25,720 | $3,200 | $22,520 |
| 2014 | -- | $25,720 | $3,200 | $22,520 |
| 2013 | -- | $27,080 | $3,200 | $23,880 |
Source: Public Records
Map
Nearby Homes
- 102 Westcliff Center St Unit D
- 110 Westcliff Center St
- 86 Westcliff Cir
- 103 Westcliff Cir Unit A
- 103 Westcliff Cir Unit A
- 110 Westcliff Cir Unit C
- 106 Westcliff Cir
- 102 Williams St
- 110 Merlin St
- 141 Peacock Dr
- 300 Meadowridge Dr
- 112 Peacock Dr
- 200 Ridgeland Dr
- 316 Meadowridge Dr
- 111 Oakridge Dr
- 118 Meadowcliff Cir
- 301 Millside Dr
- 123 Tanglewood Dr
- 209 Knodishall Dr
- 110 Foxfire Dr
- 102 Westcliff Center St Unit C
- 102 Westcliff Center St Unit B
- 102 Westcliff Center St Unit A
- 102 Westcliff Center St Unit D
- 102 Westcliff Center St
- 102 B Westcliff Center St
- 102 Westcliff Center St
- 102 Westcliff Center St
- 211 Westcliff Cir Unit B
- 211 Westcliff Cir Unit D
- 211 Westcliff Cir Unit A
- 211 Westcliff Cir Unit C
- 213 Westcliff Cir Unit C
- 213 Westcliff Cir Unit D
- 213 Westcliff Cir Unit B
- 213 Westcliff Cir Unit A
- 213 Westcliff Cir
- 213A Westcliff Cir A Unit Bldg 51 unit A
- 215 Westcliff Cir Unit D
- 215 Westcliff Cir Unit C