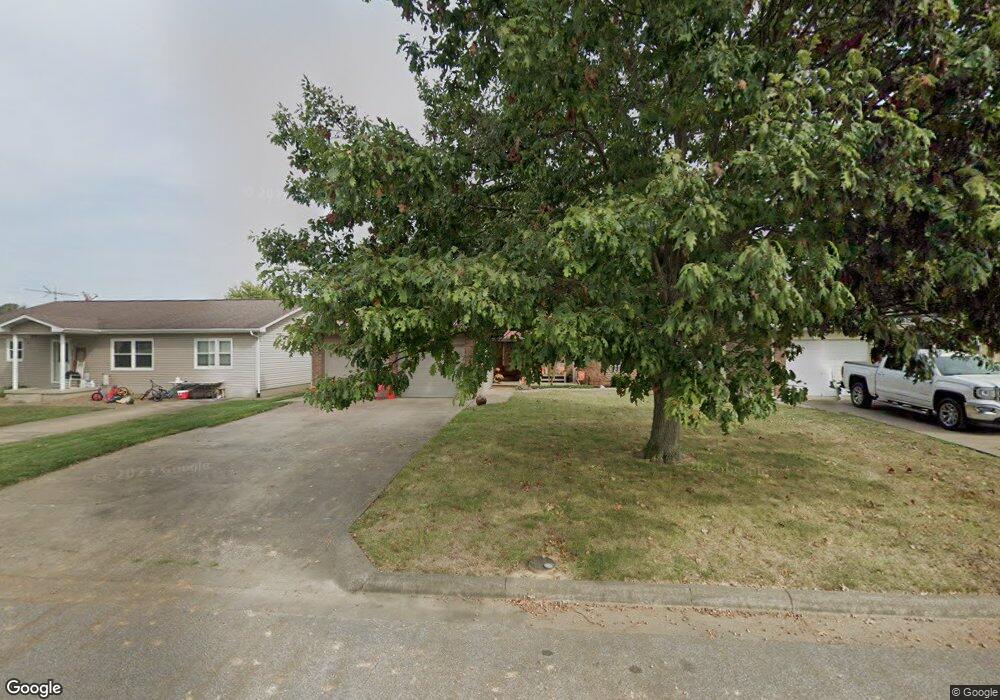
1020 21st St Tell City, IN 47586
Estimated Value: $169,000 - $235,000
3
Beds
2
Baths
1,304
Sq Ft
$151/Sq Ft
Est. Value
About This Home
This home is located at 1020 21st St, Tell City, IN 47586 and is currently estimated at $196,760, approximately $150 per square foot. 1020 21st St is a home located in Perry County with nearby schools including William Tell Elementary School, Tell City Junior/Senior High School, and Agape Christian Academy.
Ownership History
Date
Name
Owned For
Owner Type
Purchase Details
Closed on
Sep 13, 2023
Sold by
Stowe Cheryl J Le
Bought by
Harris Joshua
Current Estimated Value
Purchase Details
Closed on
Jan 29, 2008
Sold by
Stowe Cheryl J and Huff Cheryl J
Bought by
Stowe George L and Stowe Cheryl J
Home Financials for this Owner
Home Financials are based on the most recent Mortgage that was taken out on this home.
Original Mortgage
$14,250
Interest Rate
6.2%
Mortgage Type
New Conventional
Create a Home Valuation Report for This Property
The Home Valuation Report is an in-depth analysis detailing your home's value as well as a comparison with similar homes in the area
Home Values in the Area
Average Home Value in this Area
Purchase History
| Date | Buyer | Sale Price | Title Company |
|---|---|---|---|
| Harris Joshua | -- | None Listed On Document | |
| Stowe George L | -- | None Available |
Source: Public Records
Mortgage History
| Date | Status | Borrower | Loan Amount |
|---|---|---|---|
| Previous Owner | Stowe George L | $14,250 |
Source: Public Records
Tax History Compared to Growth
Tax History
| Year | Tax Paid | Tax Assessment Tax Assessment Total Assessment is a certain percentage of the fair market value that is determined by local assessors to be the total taxable value of land and additions on the property. | Land | Improvement |
|---|---|---|---|---|
| 2024 | $886 | $157,200 | $16,100 | $141,100 |
| 2023 | $715 | $150,100 | $16,100 | $134,000 |
| 2022 | $67 | $134,600 | $16,100 | $118,500 |
| 2021 | $1,100 | $117,800 | $9,500 | $108,300 |
| 2020 | $852 | $109,800 | $9,500 | $100,300 |
| 2019 | $722 | $103,200 | $9,100 | $94,100 |
| 2018 | $620 | $97,700 | $8,700 | $89,000 |
| 2017 | $562 | $95,000 | $8,700 | $86,300 |
| 2016 | $569 | $95,000 | $8,700 | $86,300 |
| 2014 | $512 | $90,900 | $8,700 | $82,200 |
| 2013 | $512 | $89,700 | $8,600 | $81,100 |
Source: Public Records
Map
Nearby Homes