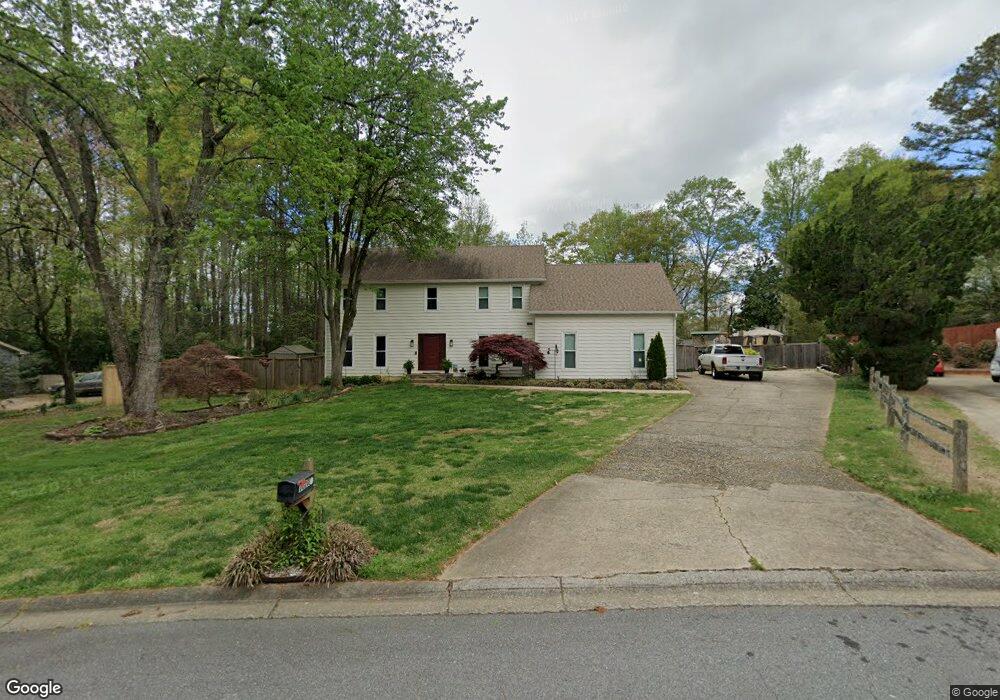
1020 Crabapple Trace Unit 2 Alpharetta, GA 30004
Estimated Value: $770,000 - $864,000
3
Beds
3
Baths
2,520
Sq Ft
$328/Sq Ft
Est. Value
About This Home
This home is located at 1020 Crabapple Trace Unit 2, Alpharetta, GA 30004 and is currently estimated at $825,316, approximately $327 per square foot. 1020 Crabapple Trace Unit 2 is a home located in Fulton County with nearby schools including Crabapple Crossing Elementary School, Northwestern Middle School, and Milton High School.
Ownership History
Date
Name
Owned For
Owner Type
Purchase Details
Closed on
Jul 14, 2005
Sold by
Bankers Trust Co Of Califronia Na
Bought by
Rouis Debra L
Current Estimated Value
Home Financials for this Owner
Home Financials are based on the most recent Mortgage that was taken out on this home.
Original Mortgage
$204,786
Outstanding Balance
$105,863
Interest Rate
5.51%
Mortgage Type
VA
Estimated Equity
$719,453
Purchase Details
Closed on
Apr 5, 2005
Sold by
Halter Jennifer
Bought by
Impac Secured Assets Corp
Purchase Details
Closed on
May 26, 2001
Sold by
Kaney Patrick A
Bought by
Halter Jennifer
Home Financials for this Owner
Home Financials are based on the most recent Mortgage that was taken out on this home.
Original Mortgage
$227,050
Interest Rate
7.23%
Mortgage Type
New Conventional
Purchase Details
Closed on
Apr 14, 2000
Sold by
Jacobs Donald
Bought by
Kaney Kevin P
Home Financials for this Owner
Home Financials are based on the most recent Mortgage that was taken out on this home.
Original Mortgage
$50,521
Interest Rate
8.27%
Mortgage Type
New Conventional
Create a Home Valuation Report for This Property
The Home Valuation Report is an in-depth analysis detailing your home's value as well as a comparison with similar homes in the area
Home Values in the Area
Average Home Value in this Area
Purchase History
| Date | Buyer | Sale Price | Title Company |
|---|---|---|---|
| Rouis Debra L | $208,000 | -- | |
| Impac Secured Assets Corp | $208,000 | -- | |
| Halter Jennifer | $239,000 | -- | |
| Kaney Kevin P | $56,000 | -- |
Source: Public Records
Mortgage History
| Date | Status | Borrower | Loan Amount |
|---|---|---|---|
| Open | Rouis Debra L | $204,786 | |
| Previous Owner | Halter Jennifer | $227,050 | |
| Previous Owner | Kaney Kevin P | $50,521 |
Source: Public Records
Tax History Compared to Growth
Tax History
| Year | Tax Paid | Tax Assessment Tax Assessment Total Assessment is a certain percentage of the fair market value that is determined by local assessors to be the total taxable value of land and additions on the property. | Land | Improvement |
|---|---|---|---|---|
| 2025 | $680 | $254,080 | $64,880 | $189,200 |
| 2023 | $680 | $238,120 | $51,640 | $186,480 |
| 2022 | $2,961 | $151,680 | $30,720 | $120,960 |
| 2021 | $3,455 | $147,280 | $29,840 | $117,440 |
| 2020 | $3,502 | $175,160 | $34,280 | $140,880 |
| 2019 | $537 | $163,800 | $80,800 | $83,000 |
| 2018 | $3,641 | $160,000 | $78,920 | $81,080 |
| 2017 | $2,908 | $115,000 | $27,080 | $87,920 |
| 2016 | $2,892 | $115,000 | $27,080 | $87,920 |
| 2015 | $3,364 | $115,000 | $27,080 | $87,920 |
| 2014 | $2,759 | $103,000 | $22,640 | $80,360 |
Source: Public Records
Map
Nearby Homes
- 175 Heatherton Ln
- 1360 Bethany Ct
- 245 Heatherton Way
- 275 Heatherton Way
- 1050 Little River Ln
- 13039 Freemanville Rd
- 12455 Pindell Cir
- 195 Wendy Hill Dr
- 1065 Mid Broadwell Rd
- 2200 Cortland Rd
- 1645 Mayfield Rd
- 1580 Mayfield Rd
- 785 Briars Bend
- 7411 Mid Broadwell Trace
- 145 Pruitt Dr
- 1395 Mid Broadwell Rd
- 1500 Mid Broadwell Rd
- 12350 Charlotte Dr
- 12575 Broadwell Rd
- 1030 Crabapple Trace
- 1010 Crabapple Trace
- 12785 Bethany Rd
- 12795 Bethany Rd
- 1040 Crabapple Trace
- 1035 Crabapple Trace
- 12775 Bethany Rd
- 1000 Crabapple Trace Unit 2
- 1050 Crabapple Trace Unit 2
- 1025 Chantilly Dr
- 1045 Bethany Rd
- 12765 Bethany Rd
- 12815 Bethany Rd
- 1030 Bethany Rd
- 1065 Crabapple Trace
- 12765 Bethany Rd
- 1060 Crabapple Trace
- 12375 Ruth's Farm Way
- 12705 Ruths Farm Way
- 1205 Wellington Place