Estimated Value: $207,000 - $302,000
3
Beds
1
Bath
1,746
Sq Ft
$140/Sq Ft
Est. Value
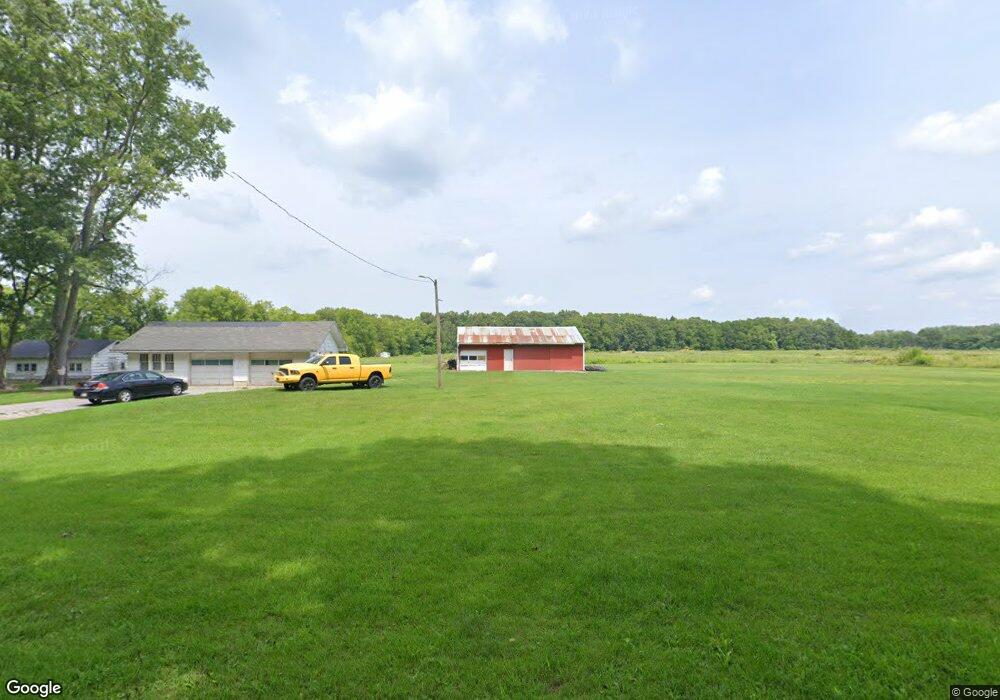
About This Home
This home is located at 1020 E 350 S, Knox, IN 46534 and is currently estimated at $244,501, approximately $140 per square foot. 1020 E 350 S is a home located in Starke County with nearby schools including Knox Community Elementary School, Knox Community Middle School, and Knox Community High School.
Ownership History
Date
Name
Owned For
Owner Type
Purchase Details
Closed on
Oct 23, 2019
Sold by
Williamson Robert A
Bought by
Williamson Ailen W
Current Estimated Value
Purchase Details
Closed on
Jul 10, 2019
Sold by
Williamson Allen W
Bought by
Williamson Robert A
Purchase Details
Closed on
Oct 1, 2008
Sold by
Williamson Stanley L
Bought by
Williamson Allen W
Purchase Details
Closed on
Sep 17, 2008
Sold by
Allen Walter
Bought by
Williamson Stanley L
Create a Home Valuation Report for This Property
The Home Valuation Report is an in-depth analysis detailing your home's value as well as a comparison with similar homes in the area
Home Values in the Area
Average Home Value in this Area
Purchase History
| Date | Buyer | Sale Price | Title Company |
|---|---|---|---|
| Williamson Ailen W | -- | None Available | |
| Williamson Robert A | -- | None Available | |
| Williamson Allen W | $46,000 | -- | |
| Williamson Allen W | -- | None Available | |
| Williamson Stanley L | $135,000 | Starke County Abstract Inc |
Source: Public Records
Tax History Compared to Growth
Tax History
| Year | Tax Paid | Tax Assessment Tax Assessment Total Assessment is a certain percentage of the fair market value that is determined by local assessors to be the total taxable value of land and additions on the property. | Land | Improvement |
|---|---|---|---|---|
| 2024 | $1,295 | $136,600 | $30,700 | $105,900 |
| 2023 | $1,274 | $124,100 | $26,700 | $97,400 |
| 2022 | $835 | $115,000 | $24,700 | $90,300 |
| 2021 | $727 | $98,500 | $23,600 | $74,900 |
| 2020 | $698 | $94,400 | $23,400 | $71,000 |
| 2019 | $698 | $88,700 | $23,100 | $65,600 |
| 2018 | $651 | $85,800 | $21,400 | $64,400 |
| 2017 | $619 | $84,300 | $21,200 | $63,100 |
| 2016 | $610 | $81,800 | $21,100 | $60,700 |
| 2014 | $554 | $82,100 | $20,900 | $61,200 |
| 2013 | $517 | $81,100 | $20,200 | $60,900 |
Source: Public Records
Map
Nearby Homes