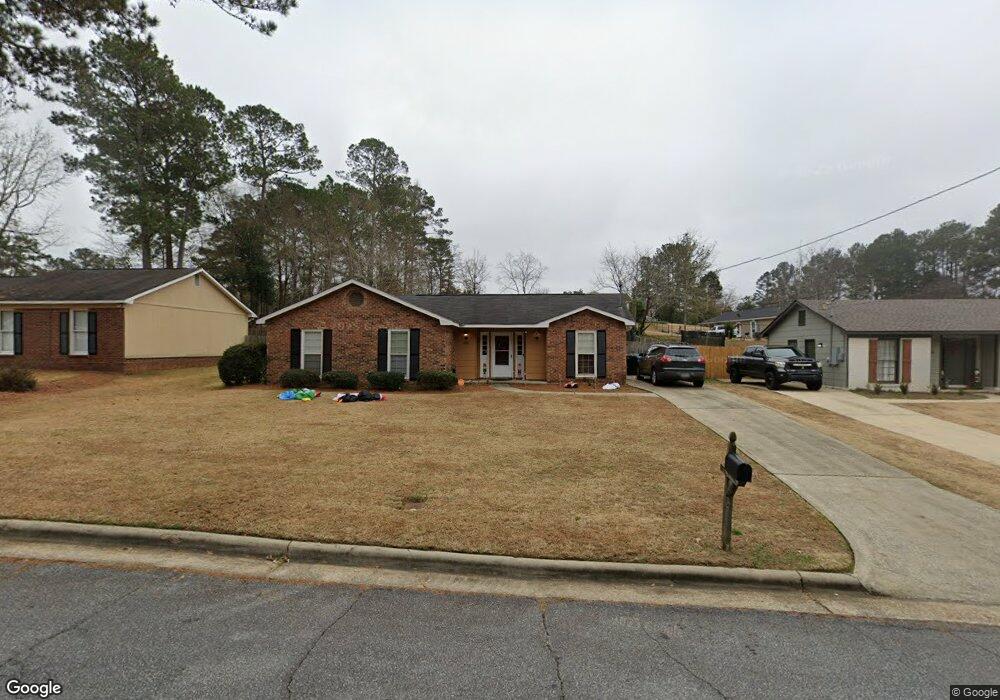
1020 Eden St Columbus, GA 31904
North Columbus NeighborhoodEstimated Value: $191,810 - $209,000
3
Beds
3
Baths
1,268
Sq Ft
$155/Sq Ft
Est. Value
About This Home
This home is located at 1020 Eden St, Columbus, GA 31904 and is currently estimated at $196,703, approximately $155 per square foot. 1020 Eden St is a home located in Muscogee County with nearby schools including Double Churches Elementary School, Veterans Memorial Middle School, and Northside High School.
Ownership History
Date
Name
Owned For
Owner Type
Purchase Details
Closed on
Jul 31, 2019
Sold by
Chi Asset Management Llc
Bought by
Ohara Shanna D
Current Estimated Value
Home Financials for this Owner
Home Financials are based on the most recent Mortgage that was taken out on this home.
Original Mortgage
$94,100
Outstanding Balance
$82,056
Interest Rate
3.7%
Mortgage Type
New Conventional
Estimated Equity
$114,647
Purchase Details
Closed on
Feb 28, 2019
Sold by
Cook Jack E
Bought by
Chi Asset Management Llc
Purchase Details
Closed on
Feb 12, 2009
Sold by
Cook Jack E and Cook Dana M
Bought by
Cook Jack E and Cook Dana M
Create a Home Valuation Report for This Property
The Home Valuation Report is an in-depth analysis detailing your home's value as well as a comparison with similar homes in the area
Home Values in the Area
Average Home Value in this Area
Purchase History
| Date | Buyer | Sale Price | Title Company |
|---|---|---|---|
| Ohara Shanna D | $126,800 | -- | |
| Chi Asset Management Llc | $113,900 | -- | |
| Cook Jack E | -- | None Available |
Source: Public Records
Mortgage History
| Date | Status | Borrower | Loan Amount |
|---|---|---|---|
| Open | Ohara Shanna D | $94,100 | |
| Closed | Ohara Shanna D | $7,340 |
Source: Public Records
Tax History
| Year | Tax Paid | Tax Assessment Tax Assessment Total Assessment is a certain percentage of the fair market value that is determined by local assessors to be the total taxable value of land and additions on the property. | Land | Improvement |
|---|---|---|---|---|
| 2025 | $1,035 | $53,616 | $8,308 | $45,308 |
| 2024 | $1,034 | $53,616 | $8,308 | $45,308 |
| 2023 | $346 | $53,616 | $8,308 | $45,308 |
| 2022 | $1,078 | $43,444 | $8,308 | $35,136 |
| 2021 | $1,071 | $39,624 | $8,308 | $31,316 |
| 2020 | $1,072 | $39,624 | $8,308 | $31,316 |
| 2019 | $895 | $39,252 | $8,308 | $30,944 |
| 2018 | $895 | $39,252 | $8,308 | $30,944 |
| 2017 | $899 | $39,252 | $8,308 | $30,944 |
| 2016 | $904 | $35,186 | $6,660 | $28,526 |
| 2015 | $906 | $35,186 | $6,660 | $28,526 |
| 2014 | $907 | $35,186 | $6,660 | $28,526 |
| 2013 | -- | $35,186 | $6,660 | $28,526 |
Source: Public Records
Map
Nearby Homes
- 8105 Trafalgar Way
- 994 Timber Creek Way
- 7841 Edgewater Dr
- 6742 Bridge Way
- 6712 Bridge Way
- 1442 Grove Park Dr Unit 2
- 1442 Grove Park Dr Unit 8
- 517 Double Churches Rd
- 1727 Fountain Ct
- 281 Zachary Ct
- 907 Double Churches Rd
- 8026 Splendor Way
- 8935 A N Moore Rd
- 7413 Whitesville Rd Unit 5
- 1438 Grove Park Dr Unit 13B
- 1438 Grove Park Dr Unit 11B
- 7340 Cedar Creek Loop
- 7309 Kirkwood Dr
- 7192 Village Loop
- 1608 Double Churches Rd
Your Personal Tour Guide
Ask me questions while you tour the home.