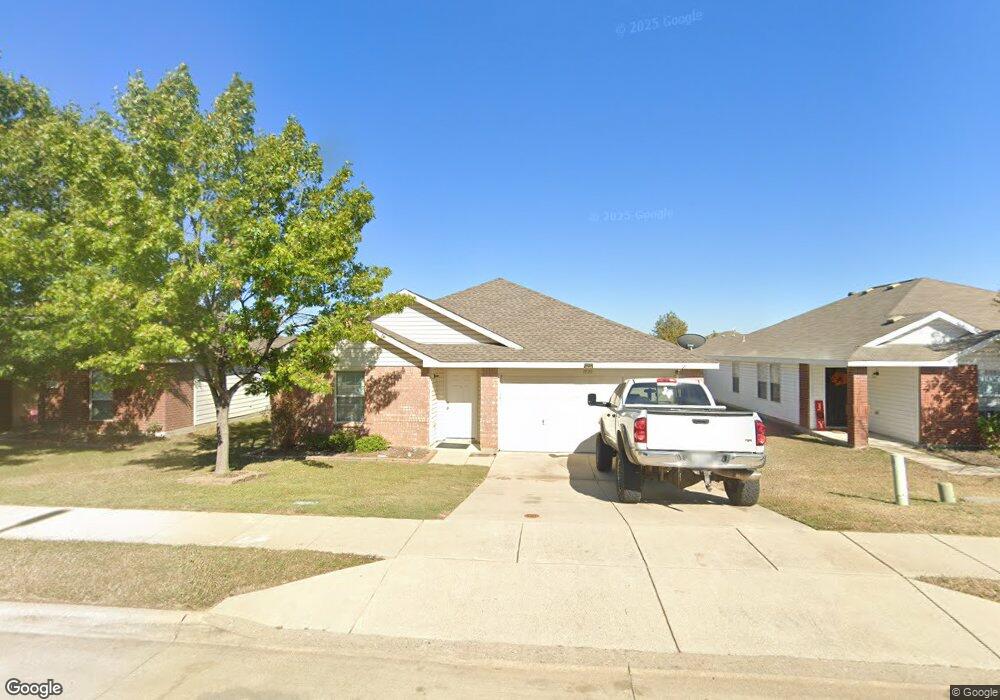
1020 Fort Apache Dr Haslet, TX 76052
Estimated Value: $277,844 - $308,000
4
Beds
2
Baths
1,928
Sq Ft
$151/Sq Ft
Est. Value
About This Home
This home is located at 1020 Fort Apache Dr, Haslet, TX 76052 and is currently estimated at $290,961, approximately $150 per square foot. 1020 Fort Apache Dr is a home located in Tarrant County with nearby schools including Sendera Ranch Elementary School, Truett Wilson Middle School, and V.R. Eaton High School.
Ownership History
Date
Name
Owned For
Owner Type
Purchase Details
Closed on
Mar 15, 2015
Sold by
Milligan Chris and Milligan Stephanie
Bought by
Eichhorst David E
Current Estimated Value
Home Financials for this Owner
Home Financials are based on the most recent Mortgage that was taken out on this home.
Original Mortgage
$93,750
Interest Rate
3.72%
Mortgage Type
New Conventional
Purchase Details
Closed on
May 23, 2005
Sold by
Lennar Homes Of Texas Land & Const Ltd
Bought by
Nuhome Of Texas
Home Financials for this Owner
Home Financials are based on the most recent Mortgage that was taken out on this home.
Original Mortgage
$107,793
Interest Rate
5.83%
Mortgage Type
FHA
Purchase Details
Closed on
May 20, 2005
Sold by
Nuhome Of Texas
Bought by
Keeton James
Home Financials for this Owner
Home Financials are based on the most recent Mortgage that was taken out on this home.
Original Mortgage
$107,793
Interest Rate
5.83%
Mortgage Type
FHA
Create a Home Valuation Report for This Property
The Home Valuation Report is an in-depth analysis detailing your home's value as well as a comparison with similar homes in the area
Home Values in the Area
Average Home Value in this Area
Purchase History
| Date | Buyer | Sale Price | Title Company |
|---|---|---|---|
| Eichhorst David E | -- | Lt | |
| Nuhome Of Texas | -- | -- | |
| Keeton James | -- | -- | |
| Nuhome Of Texas | -- | -- | |
| Milligan Chris | -- | -- |
Source: Public Records
Mortgage History
| Date | Status | Borrower | Loan Amount |
|---|---|---|---|
| Previous Owner | Eichhorst David E | $93,750 | |
| Previous Owner | Milligan Chris | $107,793 |
Source: Public Records
Tax History
| Year | Tax Paid | Tax Assessment Tax Assessment Total Assessment is a certain percentage of the fair market value that is determined by local assessors to be the total taxable value of land and additions on the property. | Land | Improvement |
|---|---|---|---|---|
| 2025 | $3,430 | $281,300 | $65,000 | $216,300 |
| 2024 | $3,430 | $297,000 | $65,000 | $232,000 |
| 2023 | $7,697 | $340,000 | $55,000 | $285,000 |
| 2022 | $6,460 | $251,784 | $40,000 | $211,784 |
| 2021 | $5,465 | $195,000 | $40,000 | $155,000 |
| 2020 | $5,374 | $195,000 | $40,000 | $155,000 |
| 2019 | $5,732 | $199,773 | $40,000 | $159,773 |
| 2018 | $2,573 | $186,500 | $40,000 | $146,500 |
| 2017 | $5,295 | $181,695 | $23,000 | $158,695 |
| 2016 | $4,661 | $169,330 | $23,000 | $146,330 |
| 2015 | $3,482 | $145,412 | $23,000 | $122,412 |
| 2014 | $3,482 | $133,200 | $23,500 | $109,700 |
Source: Public Records
Map
Nearby Homes
- 1008 Fort Apache Dr
- 14112 Cochise Dr
- 1037 Castle Top Dr
- 1101 Castle Top Dr
- 1112 Day Dream Dr
- 1113 Day Dream Dr
- 14001 Cedar Post Dr
- 14301 Polo Ranch St
- 14909 Hierba Mora Dr
- 14308 Snaffle Bit Trail
- 804 Rio Bravo Dr
- 712 Rio Bravo Dr
- 1173 Roping Reins Way
- 14205 Bay Mare Way
- 1313 Zanna Grace Way
- 605 Rosario Ln
- 13625 Saddlewood Dr
- 13544 Leather Strap Dr
- 1424 Fence Post Dr
- 1209 Beau Jake Ct
- 1016 Fort Apache Dr
- 1024 Fort Apache Dr
- 14101 Playa Trail
- 1012 Fort Apache Dr
- 1028 Fort Apache Dr
- 14105 Playa Trail
- 14100 Playa Trail
- 1021 Fort Apache Dr
- 1025 Fort Apache Dr
- 1017 Fort Apache Dr
- 1029 Fort Apache Dr
- 14100 Cochise Dr
- 14108 Cochise Dr
- 1013 Fort Apache Dr
- 1033 Fort Apache Dr
- 1004 Fort Apache Dr
- 14109 Playa Trail
- 14104 Playa Trail
- 14116 Cochise Dr
- 14109 Esperanza Dr
Your Personal Tour Guide
Ask me questions while you tour the home.