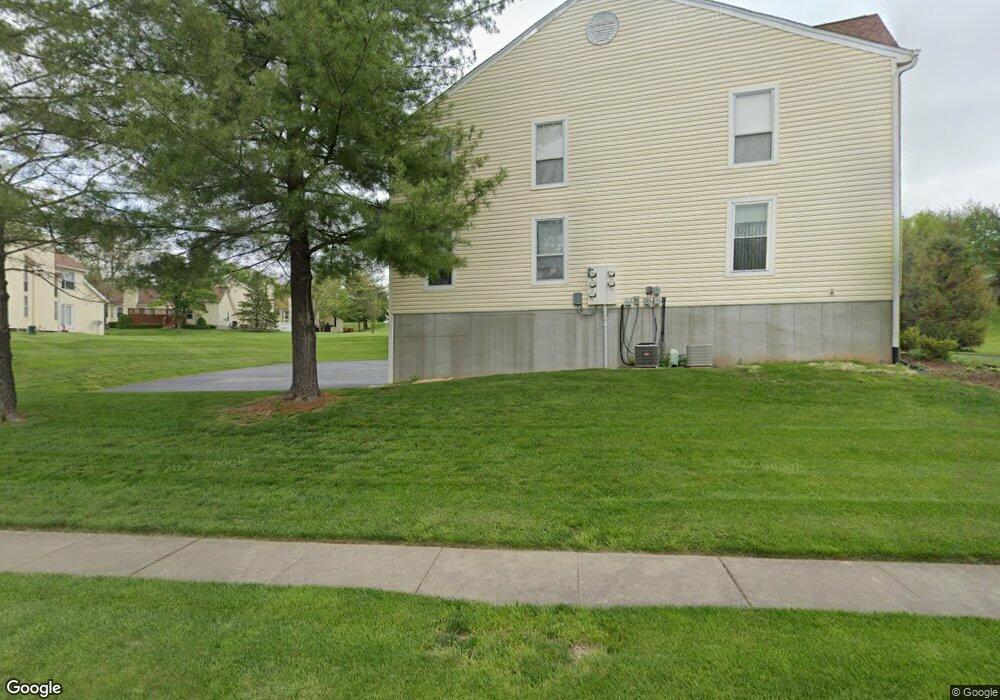
1020 Gifford Ct Unit A Florissant, MO 63031
Estimated Value: $106,900 - $185,000
2
Beds
2
Baths
1,017
Sq Ft
$141/Sq Ft
Est. Value
About This Home
This home is located at 1020 Gifford Ct Unit A, Florissant, MO 63031 and is currently estimated at $143,725, approximately $141 per square foot. 1020 Gifford Ct Unit A is a home located in St. Louis County with nearby schools including Russell Elementary School, West Middle School, and Hazelwood West High School.
Ownership History
Date
Name
Owned For
Owner Type
Purchase Details
Closed on
Sep 29, 2021
Sold by
Rivera Lizbeth and Nordmann Lizbeth C
Bought by
Rivera Jimmy and Rivera Lizbeth
Current Estimated Value
Home Financials for this Owner
Home Financials are based on the most recent Mortgage that was taken out on this home.
Original Mortgage
$88,000
Outstanding Balance
$80,073
Interest Rate
2.8%
Mortgage Type
New Conventional
Estimated Equity
$63,652
Purchase Details
Closed on
Sep 27, 2002
Sold by
Malagutti Macie W and Nitchman Kelly J
Bought by
Nordmann Lizbeth C
Home Financials for this Owner
Home Financials are based on the most recent Mortgage that was taken out on this home.
Original Mortgage
$93,450
Interest Rate
6.09%
Purchase Details
Closed on
Sep 30, 1997
Sold by
Malagutti Macie W
Bought by
Nitchman Kelly J and Malaguitti Patrick M
Create a Home Valuation Report for This Property
The Home Valuation Report is an in-depth analysis detailing your home's value as well as a comparison with similar homes in the area
Home Values in the Area
Average Home Value in this Area
Purchase History
| Date | Buyer | Sale Price | Title Company |
|---|---|---|---|
| Rivera Jimmy | -- | Amrock Llc | |
| Nordmann Lizbeth C | $92,000 | -- | |
| Nitchman Kelly J | -- | -- |
Source: Public Records
Mortgage History
| Date | Status | Borrower | Loan Amount |
|---|---|---|---|
| Open | Rivera Jimmy | $88,000 | |
| Closed | Nordmann Lizbeth C | $93,450 |
Source: Public Records
Tax History Compared to Growth
Tax History
| Year | Tax Paid | Tax Assessment Tax Assessment Total Assessment is a certain percentage of the fair market value that is determined by local assessors to be the total taxable value of land and additions on the property. | Land | Improvement |
|---|---|---|---|---|
| 2025 | $1,726 | $24,970 | $2,700 | $22,270 |
| 2024 | $1,726 | $21,450 | $1,840 | $19,610 |
| 2023 | $1,743 | $21,450 | $1,840 | $19,610 |
| 2022 | $1,645 | $18,100 | $2,220 | $15,880 |
| 2021 | $1,617 | $18,100 | $2,220 | $15,880 |
| 2020 | $1,382 | $14,480 | $2,220 | $12,260 |
| 2019 | $1,362 | $14,480 | $2,220 | $12,260 |
| 2018 | $1,313 | $12,940 | $970 | $11,970 |
| 2017 | $1,311 | $12,940 | $970 | $11,970 |
| 2016 | $1,251 | $12,210 | $2,220 | $9,990 |
| 2015 | $1,201 | $12,210 | $2,220 | $9,990 |
| 2014 | $1,452 | $14,690 | $3,760 | $10,930 |
Source: Public Records
Map
Nearby Homes
- 924 Zohner Ct
- 2 Taylor Trail Place
- 134 Beaujolais Dr
- 12 Miraclair Dr
- 248 Chianti Ct
- 1135 Martin Manor Place
- 154 Riverwood Park Dr
- 5 Seminary Ct
- 1227 Teson Rd
- 7250 Howdershell Rd
- 1101 Nathaniel Ct
- 1090 Howdershell Rd
- 1035 Rosary Tree Ct
- 60 Charbonier Bluffs Dr
- 121 Kendl Ct
- 1790 Tahoe Dr
- 95 Charbonier Bluffs Dr
- 1209 Woodcrest Ln
- 2324 Fernau Ct
- 2320 Fernau Ct
- 1020 Gifford Ct Unit C
- 1020 Gifford Ct Unit D
- 1020 Gifford Ct Unit B
- 1014 Gifford Ct Unit C
- 1014 Gifford Ct Unit B
- 1014 Gifford Ct Unit D
- 1014 Gifford Ct Unit A
- 1026 Gifford Ct Unit 1026
- 1038 Gifford Ct
- 1030 Gifford Ct
- 1034 Gifford Ct
- 1042 Gifford Ct
- 2313 Riverwood Trails Dr
- 2311 Riverwood Trails Dr
- 2309 Riverwood Trails Dr
- 2315 Riverwood Trails Dr
- 2305 Riverwood Trails Dr Unit 2305
- 2307 Riverwood Trails Dr
- 2301 Riverwood Trails Dr
- 2303 Riverwood Trails Dr