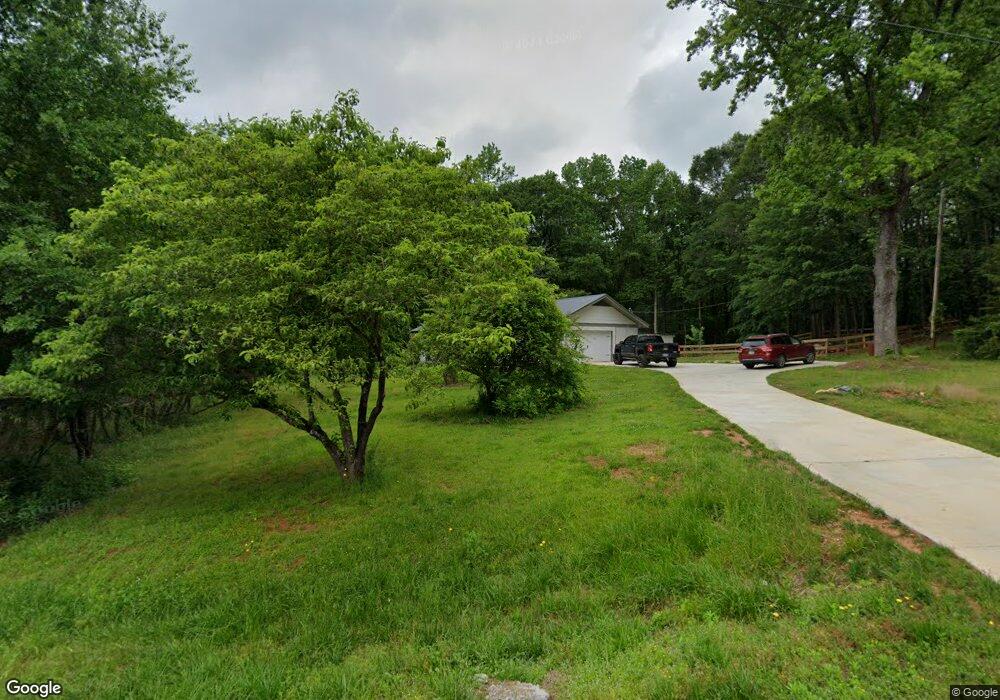
1020 Hubbard Rd Carnesville, GA 30521
Estimated Value: $262,000 - $363,000
3
Beds
2
Baths
1,594
Sq Ft
$200/Sq Ft
Est. Value
About This Home
This home is located at 1020 Hubbard Rd, Carnesville, GA 30521 and is currently estimated at $318,818, approximately $200 per square foot. 1020 Hubbard Rd is a home located in Franklin County with nearby schools including Franklin County High School.
Ownership History
Date
Name
Owned For
Owner Type
Purchase Details
Closed on
Aug 31, 2022
Sold by
Holman Lewis Lamar
Bought by
Holman Lewis Lamar and Andrus Megan
Current Estimated Value
Home Financials for this Owner
Home Financials are based on the most recent Mortgage that was taken out on this home.
Original Mortgage
$270,000
Outstanding Balance
$257,406
Interest Rate
4.99%
Mortgage Type
New Conventional
Estimated Equity
$61,412
Purchase Details
Closed on
Feb 22, 2022
Sold by
Hall E Kent
Bought by
Holman Lewis Lamar and Holman Shawn M
Purchase Details
Closed on
Sep 20, 2021
Sold by
Swindell Patricia E
Bought by
Hall E Kent
Home Financials for this Owner
Home Financials are based on the most recent Mortgage that was taken out on this home.
Original Mortgage
$100,000
Interest Rate
2.8%
Mortgage Type
Commercial
Purchase Details
Closed on
Jan 28, 2020
Sold by
Swindell Leland L
Bought by
Grizzle Breanna Elizabeth
Purchase Details
Closed on
Apr 30, 1978
Bought by
Swindell Lefland L
Create a Home Valuation Report for This Property
The Home Valuation Report is an in-depth analysis detailing your home's value as well as a comparison with similar homes in the area
Home Values in the Area
Average Home Value in this Area
Purchase History
| Date | Buyer | Sale Price | Title Company |
|---|---|---|---|
| Holman Lewis Lamar | $337,500 | -- | |
| Holman Lewis Lamar | $195,000 | -- | |
| Hall E Kent | $120,000 | -- | |
| Swindell Patricia E | -- | -- | |
| Grizzle Breanna Elizabeth | $20,000 | -- | |
| Swindell Lefland L | -- | -- |
Source: Public Records
Mortgage History
| Date | Status | Borrower | Loan Amount |
|---|---|---|---|
| Open | Holman Lewis Lamar | $270,000 | |
| Previous Owner | Swindell Patricia E | $100,000 |
Source: Public Records
Tax History Compared to Growth
Tax History
| Year | Tax Paid | Tax Assessment Tax Assessment Total Assessment is a certain percentage of the fair market value that is determined by local assessors to be the total taxable value of land and additions on the property. | Land | Improvement |
|---|---|---|---|---|
| 2024 | $2,194 | $92,187 | $13,407 | $78,780 |
| 2023 | $1,478 | $57,288 | $12,188 | $45,100 |
| 2022 | $1,312 | $50,867 | $9,687 | $41,180 |
| 2021 | $817 | $49,712 | $9,687 | $40,025 |
| 2020 | $1,094 | $49,351 | $17,193 | $32,158 |
| 2019 | $1,057 | $49,351 | $17,193 | $32,158 |
| 2018 | $853 | $41,758 | $13,720 | $28,038 |
| 2017 | $887 | $41,758 | $13,720 | $28,038 |
| 2016 | $801 | $37,453 | $13,720 | $23,733 |
| 2015 | -- | $37,452 | $13,720 | $23,733 |
| 2014 | -- | $37,453 | $13,720 | $23,733 |
| 2013 | -- | $0 | $0 | $0 |
Source: Public Records
Map
Nearby Homes
- 340 Telford Rd
- 110 Telford Rd
- 456 Aderhold Rd
- 499 Aderhold Rd
- 7690 Royston Rd
- 0 Murphy Rd Unit 10585891
- 210 Nora Moss Ln
- 735 Bowersville Rd
- 0 Manley St Unit 10611784
- 2556 Turkey Creek Rd
- 0 Turkey Creek Rd Unit 10589237
- 228 Franklin Hills Dr
- 228 Franklin Hills Dr Unit B14
- 7 Crest View Cir
- 10170 Lavonia Rd
- 2985 Jackson Bridge Rd
- 2695 Brays Lake Rd
- 5821 Georgia 320
- 365 Carroll Church Rd
- 1079 Hardeman Farm Rd
- 1045 Hubbard Rd
- 1160 Hubbard Rd
- 1222 Hubbard Rd
- 0 Rockyfo Rd Unit 20033696
- 808 Hubbard Rd
- 88 Rockyford Rd
- 0 Rocky Ford Rd Unit 3 7499632
- 0 Rocky Ford Rd Unit CM903852
- 0 Rocky Ford Rd Unit CM914544
- 0 Rocky Ford Rd Unit 7564532
- 0 Mcclain Rd Unit 10472110
- 0 Mcclain Rd Unit 7581014
- 660 Hubbard Rd
- 641 Hubbard Rd
- 305 Telford Rd
- 555 Hubbard Rd
- 555 Hubbard Rd
- 361 Rockyford Rd
- 435 Hubbard Rd
- 270 Telford Rd