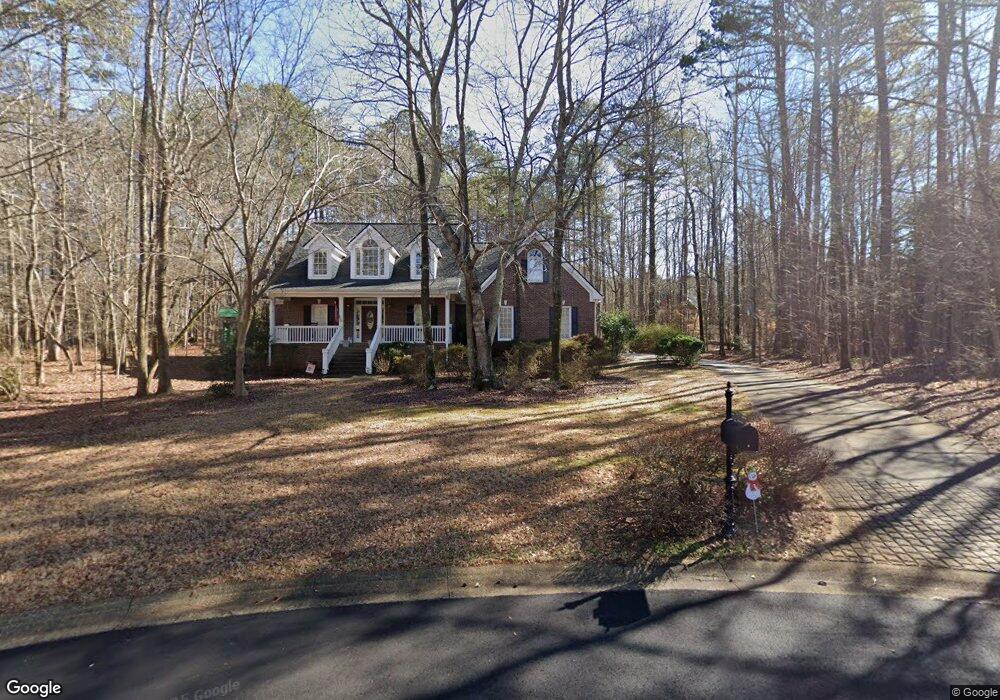
1020 Kaplan Ct Bogart, GA 30622
Estimated Value: $506,000 - $562,000
--
Bed
--
Bath
2,096
Sq Ft
$252/Sq Ft
Est. Value
About This Home
This home is located at 1020 Kaplan Ct, Bogart, GA 30622 and is currently estimated at $529,207, approximately $252 per square foot. 1020 Kaplan Ct is a home located in Oconee County with nearby schools including Malcom Bridge Elementary School, Malcom Bridge Middle School, and North Oconee High School.
Ownership History
Date
Name
Owned For
Owner Type
Purchase Details
Closed on
Sep 15, 2014
Sold by
Bassett Troy C
Bought by
Bassett Troy C and Bassett Amy H
Current Estimated Value
Home Financials for this Owner
Home Financials are based on the most recent Mortgage that was taken out on this home.
Original Mortgage
$157,800
Outstanding Balance
$52,117
Interest Rate
4.17%
Mortgage Type
New Conventional
Estimated Equity
$477,090
Purchase Details
Closed on
Dec 24, 2009
Sold by
Bassett Amy H
Bought by
Bassett Troy C
Home Financials for this Owner
Home Financials are based on the most recent Mortgage that was taken out on this home.
Original Mortgage
$200,000
Interest Rate
4.75%
Mortgage Type
New Conventional
Purchase Details
Closed on
Jul 9, 1999
Sold by
Michael Michael J and Michael Ross
Bought by
Bassett Troy and Bassett Amy
Purchase Details
Closed on
Jul 7, 1998
Sold by
Higginbotham Thomas
Bought by
Michael Michael J and Michael Ross
Create a Home Valuation Report for This Property
The Home Valuation Report is an in-depth analysis detailing your home's value as well as a comparison with similar homes in the area
Home Values in the Area
Average Home Value in this Area
Purchase History
| Date | Buyer | Sale Price | Title Company |
|---|---|---|---|
| Bassett Troy C | -- | -- | |
| Bassett Troy C | -- | -- | |
| Bassett Troy | $197,300 | -- | |
| Michael Michael J | $94,500 | -- |
Source: Public Records
Mortgage History
| Date | Status | Borrower | Loan Amount |
|---|---|---|---|
| Open | Bassett Troy C | $157,800 | |
| Previous Owner | Bassett Troy C | $200,000 |
Source: Public Records
Tax History Compared to Growth
Tax History
| Year | Tax Paid | Tax Assessment Tax Assessment Total Assessment is a certain percentage of the fair market value that is determined by local assessors to be the total taxable value of land and additions on the property. | Land | Improvement |
|---|---|---|---|---|
| 2024 | $3,329 | $178,106 | $36,000 | $142,106 |
| 2023 | $3,329 | $161,216 | $28,000 | $133,216 |
| 2022 | $3,098 | $144,583 | $28,000 | $116,583 |
| 2021 | $2,891 | $125,218 | $24,000 | $101,218 |
| 2020 | $2,864 | $123,872 | $24,000 | $99,872 |
| 2019 | $2,849 | $123,210 | $24,000 | $99,210 |
| 2018 | $2,718 | $115,131 | $24,000 | $91,131 |
| 2017 | $2,393 | $101,379 | $22,000 | $79,379 |
| 2016 | $2,247 | $95,237 | $22,000 | $73,237 |
| 2015 | $2,098 | $88,747 | $22,000 | $66,747 |
| 2014 | -- | $86,026 | $22,000 | $64,026 |
| 2013 | -- | $89,727 | $28,000 | $61,727 |
Source: Public Records
Map
Nearby Homes
- 1191 Arizona Bend
- 1110 Colorado Bend
- 1700 Jimmy Daniel Rd
- 0 Tall Oaks Rd Unit 1027657
- 0 Tall Oaks Rd Unit 1027658
- 0 Tall Oaks Rd Unit 10550493
- 0 Tall Oaks Rd Unit 10550492
- 2232 Orchard Cir
- 0 Julian Dr Unit 10476456
- 1102 Blackstone Ct
- 310 Marlborough Downs Rd
- 3492 Orchard Cir
- 2080 Orchard Walk
- 255 Marlborough Downs Rd
- 1266 Orchard Way
- 1090 Kenway Dr
- 115 Altarstone Dr
- 367 Morning Dr
- 1320 Arizona Bend
- 1320 Arizona Bend
- 1021 Kaplan Ct
- 1220 Arizona Bend
- 1011 Kaplan Ct
- 1230 Arizona Bend
- 1210 Arizona Bend
- 1300 Arizona Bend
- 1300 Arizona Bend
- 1030 Bob White Ct
- 1011 Kaplan Ct
- 1220 Arizona Bend
- 1250 Arizona Bend
- 0 Kaplan Ct Unit 8482787
- 1062 Canter Bend Unit 33
- 1062 Canter Bend
- 1250 Arizona Bend
- 1021 Bob White Ct
- 1200 Arizona Bend
- 0 Bob White Ct Unit 7411686