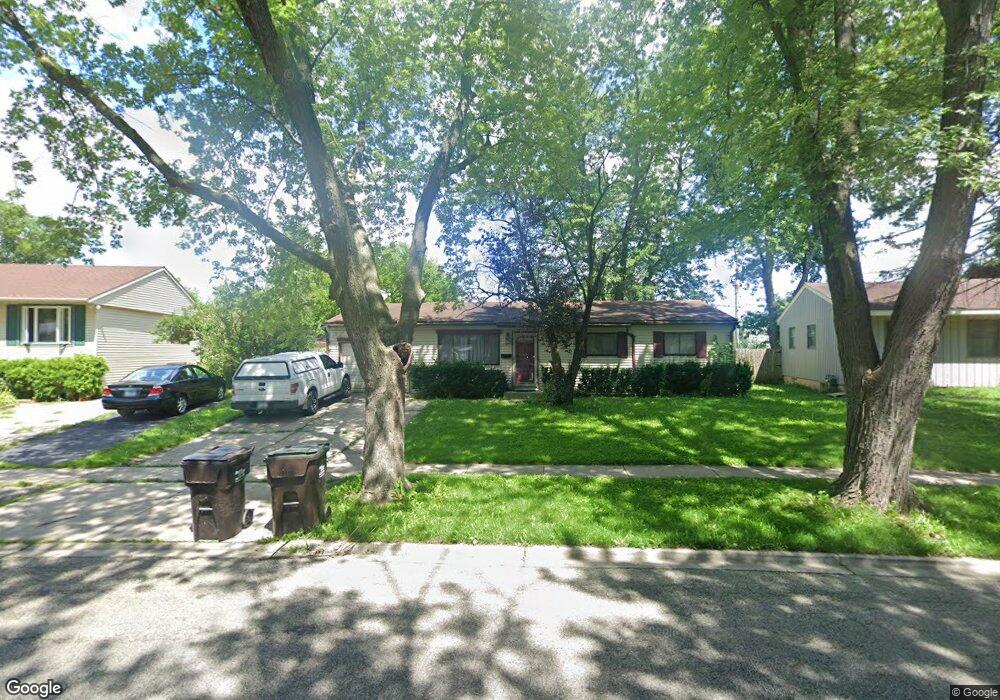
1020 Larkdale Row Wauconda, IL 60084
Estimated Value: $238,000 - $268,000
3
Beds
1
Bath
1,014
Sq Ft
$247/Sq Ft
Est. Value
About This Home
This home is located at 1020 Larkdale Row, Wauconda, IL 60084 and is currently estimated at $250,584, approximately $247 per square foot. 1020 Larkdale Row is a home located in Lake County with nearby schools including Robert Crown School, Wauconda Middle School, and Wauconda High School.
Ownership History
Date
Name
Owned For
Owner Type
Purchase Details
Closed on
Jul 2, 2021
Sold by
Delannoy Jorge and Delannoy Maria
Bought by
Ocampo Salvador and Ocampo Leticia
Current Estimated Value
Home Financials for this Owner
Home Financials are based on the most recent Mortgage that was taken out on this home.
Original Mortgage
$132,554
Interest Rate
2.9%
Mortgage Type
FHA
Purchase Details
Closed on
Jun 14, 2007
Sold by
Kozdon Janusz and Kozdon Esperanza
Bought by
Delannoy Jorge and Delannoy Maria M
Home Financials for this Owner
Home Financials are based on the most recent Mortgage that was taken out on this home.
Original Mortgage
$132,000
Interest Rate
6.2%
Mortgage Type
Purchase Money Mortgage
Purchase Details
Closed on
Aug 8, 1994
Sold by
Braun Robert J and Braun Christine M
Bought by
Kozdon Janusz and Kozdon Esperanza
Home Financials for this Owner
Home Financials are based on the most recent Mortgage that was taken out on this home.
Original Mortgage
$100,205
Interest Rate
8.62%
Mortgage Type
FHA
Create a Home Valuation Report for This Property
The Home Valuation Report is an in-depth analysis detailing your home's value as well as a comparison with similar homes in the area
Home Values in the Area
Average Home Value in this Area
Purchase History
| Date | Buyer | Sale Price | Title Company |
|---|---|---|---|
| Ocampo Salvador | $135,000 | Chicago Title | |
| Delannoy Jorge | $165,000 | None Available | |
| Kozdon Janusz | $101,000 | Attorneys Natl Title Network |
Source: Public Records
Mortgage History
| Date | Status | Borrower | Loan Amount |
|---|---|---|---|
| Previous Owner | Ocampo Salvador | $132,554 | |
| Previous Owner | Delannoy Jorge | $132,000 | |
| Previous Owner | Kozdon Janusz | $100,205 |
Source: Public Records
Tax History Compared to Growth
Tax History
| Year | Tax Paid | Tax Assessment Tax Assessment Total Assessment is a certain percentage of the fair market value that is determined by local assessors to be the total taxable value of land and additions on the property. | Land | Improvement |
|---|---|---|---|---|
| 2024 | $5,340 | $65,398 | $17,352 | $48,046 |
| 2023 | $5,874 | $54,344 | $14,419 | $39,925 |
| 2022 | $5,874 | $53,829 | $17,549 | $36,280 |
| 2021 | $5,630 | $50,863 | $16,582 | $34,281 |
| 2020 | $5,470 | $48,477 | $15,804 | $32,673 |
| 2019 | $4,876 | $45,815 | $14,936 | $30,879 |
| 2018 | $4,476 | $38,913 | $15,737 | $23,176 |
| 2017 | $4,474 | $38,463 | $15,555 | $22,908 |
| 2016 | $4,221 | $36,423 | $14,730 | $21,693 |
| 2015 | $3,998 | $33,437 | $13,522 | $19,915 |
| 2014 | $2,982 | $32,387 | $9,854 | $22,533 |
| 2012 | $2,934 | $31,537 | $9,429 | $22,108 |
Source: Public Records
Map
Nearby Homes
- 26036 Illinois Route 59
- 532 Brown St
- 225 Larkdale Row
- 240 Regency Ct
- 235 Regency Ct Unit B
- 225 Regency Ct Unit A
- 136 Parkview Dr Unit 5136
- 26241 W Bonner Rd
- 335 Farmhill Cir
- 26049 N Il Route 59
- 28177 N Garland Rd
- 450 N Main St Unit S307A
- 450 N Main St Unit S208A
- 311 Brown St
- 651 W Liberty St Unit B
- 136 Hubbard Ct
- 29295 N Callahan Rd
- 28855 N Garland Rd
- 131 E Mill St Unit B104
- 29564 N Garland Rd
- 1030 Larkdale Row
- 1010 Larkdale Row
- 1040 Larkdale Row
- 1000 Larkdale Row
- 1025 N Rand Rd
- 1050 Larkdale Row
- 1015 Larkdale Row
- 1005 Larkdale Row
- 1035 Larkdale Row
- 1060 Larkdale Row
- 1043 Larkdale Row
- 635 Laurel Ave Unit 8
- 620 Laurel Ave
- 643 Marine Dr
- 640 Marine Dr
- 1070 Larkdale Row
- 1055 Larkdale Row
- 945 Larkdale Row
- 645 Laurel Ave
- 648 Marine Dr