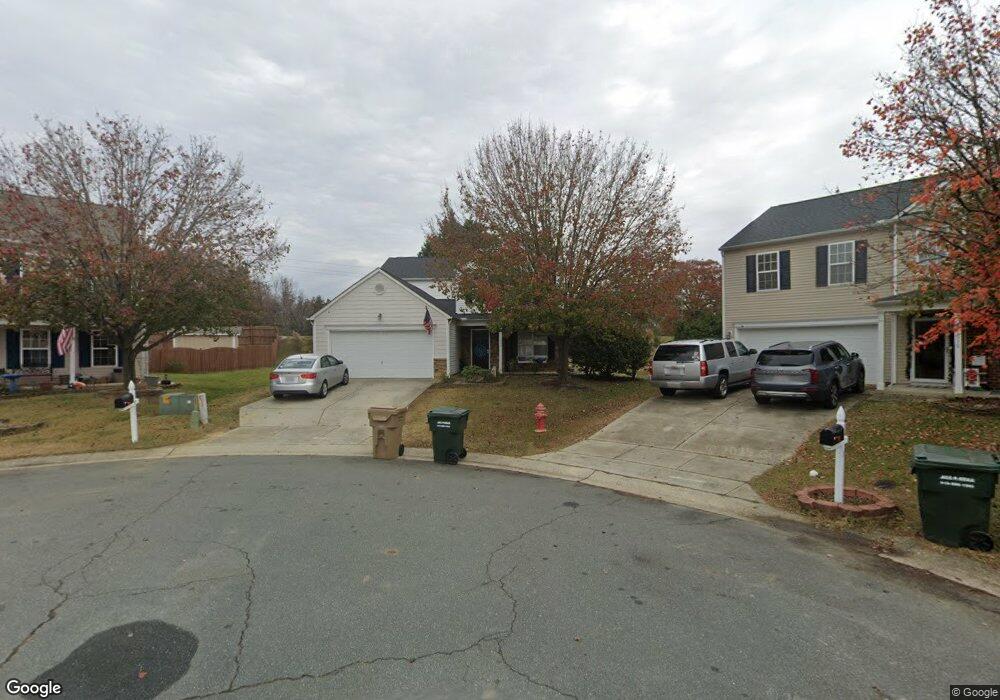
1020 Limeberry Ct Clayton, NC 27520
Estimated Value: $381,000 - $405,000
5
Beds
3
Baths
2,564
Sq Ft
$154/Sq Ft
Est. Value
About This Home
This home is located at 1020 Limeberry Ct, Clayton, NC 27520 and is currently estimated at $393,980, approximately $153 per square foot. 1020 Limeberry Ct is a home located in Johnston County with nearby schools including West Clayton Elementary School, Clayton Middle School, and Clayton High.
Ownership History
Date
Name
Owned For
Owner Type
Purchase Details
Closed on
Jul 3, 2019
Sold by
Stewart Kelly S and Hernandez Juan
Bought by
Vereen Truman A and Vereen Miah B
Current Estimated Value
Home Financials for this Owner
Home Financials are based on the most recent Mortgage that was taken out on this home.
Original Mortgage
$235,474
Outstanding Balance
$208,567
Interest Rate
4.37%
Mortgage Type
FHA
Estimated Equity
$185,413
Purchase Details
Closed on
Feb 15, 2005
Sold by
Centex Homes
Bought by
Stewart Kelly S
Home Financials for this Owner
Home Financials are based on the most recent Mortgage that was taken out on this home.
Original Mortgage
$142,440
Interest Rate
5.72%
Mortgage Type
New Conventional
Purchase Details
Closed on
Feb 15, 2004
Sold by
Stewart Kelly S
Bought by
Centex Homes
Create a Home Valuation Report for This Property
The Home Valuation Report is an in-depth analysis detailing your home's value as well as a comparison with similar homes in the area
Home Values in the Area
Average Home Value in this Area
Purchase History
| Date | Buyer | Sale Price | Title Company |
|---|---|---|---|
| Vereen Truman A | $240,000 | None Available | |
| Stewart Kelly S | $178,500 | None Available | |
| Centex Homes | $178,500 | -- |
Source: Public Records
Mortgage History
| Date | Status | Borrower | Loan Amount |
|---|---|---|---|
| Open | Vereen Truman A | $235,474 | |
| Previous Owner | Stewart Kelly S | $142,440 |
Source: Public Records
Tax History Compared to Growth
Tax History
| Year | Tax Paid | Tax Assessment Tax Assessment Total Assessment is a certain percentage of the fair market value that is determined by local assessors to be the total taxable value of land and additions on the property. | Land | Improvement |
|---|---|---|---|---|
| 2025 | $3,912 | $387,370 | $85,000 | $302,370 |
| 2024 | $3,261 | $247,060 | $48,000 | $199,060 |
| 2023 | $3,187 | $247,060 | $48,000 | $199,060 |
| 2022 | $3,286 | $247,060 | $48,000 | $199,060 |
| 2021 | $3,236 | $247,060 | $48,000 | $199,060 |
| 2020 | $3,311 | $247,060 | $48,000 | $199,060 |
| 2019 | $3,311 | $247,060 | $48,000 | $199,060 |
| 2018 | $2,747 | $202,010 | $37,000 | $165,010 |
| 2017 | $2,687 | $202,010 | $37,000 | $165,010 |
| 2016 | $2,687 | $202,010 | $37,000 | $165,010 |
| 2015 | $2,636 | $202,010 | $37,000 | $165,010 |
| 2014 | $2,636 | $202,010 | $37,000 | $165,010 |
Source: Public Records
Map
Nearby Homes
- 3001 Softwind Dr
- 3009 Wynston Way
- 37 Pink Iris Ct
- 36 Pink Iris Ct
- 14 Ct
- 24 Pink Iris Ct
- 49 W Fire Opal Ct
- 54 E Fire Opal Ct
- 1812 Parkside Village Dr
- 215 W Moss Creek Dr
- 2021 Fort Dr
- 3069 Buttonwood Ln
- 176 Red Jasper Way
- 154 Red Jasper Way
- 142 Red Jasper Way
- 166 Red Jasper Way
- 128 E Moss Creek Dr
- 5721 Satinwood Dr
- 113 Butternut Ln
- 479 Winding Wood Dr
- 1016 Limeberry Ct
- 1025 Limeberry Ct
- 1012 Limeberry Ct
- 1021 Limeberry Ct
- 1017 Dewberry Ct
- 1021 Dewberry Ct
- 1017 Limeberry Ct
- 1008 Limeberry Ct
- 1013 Dewberry Ct
- 1013 Limeberry Ct
- 1009 Dewberry Ct
- 1024 Dewberry Ct
- 1004 Limeberry Ct
- 1020 Lockberry Ct
- 1005 Dewberry Ct
- 1024 Lockberry Ct
- 1016 Lockberry Ct
- 1020 Dewberry Ct
- 6008 Softwind Dr
- 1005 Limeberry Ct