Estimated Value: $78,000 - $133,000
3
Beds
2
Baths
888
Sq Ft
$130/Sq Ft
Est. Value
About This Home
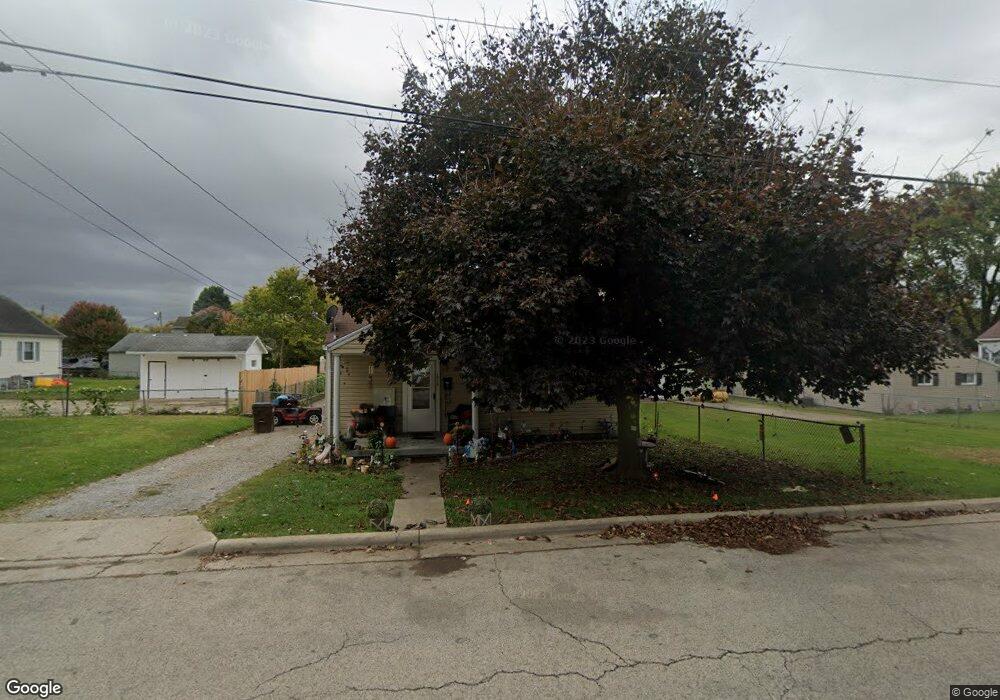
This home is located at 1020 Mcdowell St, Xenia, OH 45385 and is currently estimated at $115,466, approximately $130 per square foot. 1020 Mcdowell St is a home located in Greene County with nearby schools including Xenia High School, Summit Academy Community School for Alternative Learners - Xenia, and Legacy Christian Academy.
Ownership History
Date
Name
Owned For
Owner Type
Purchase Details
Closed on
Apr 18, 2008
Sold by
The Huntington National Bank
Bought by
Hall Carl W
Current Estimated Value
Purchase Details
Closed on
Aug 23, 2007
Sold by
Parks Larry E and Parks Angela L
Bought by
Sky Bank and Sky Bank Ohio Bank Region
Purchase Details
Closed on
Jul 31, 1998
Sold by
Miller Dustin and Lewis Christine C
Bought by
Parks Larry E and Parks Angela L
Home Financials for this Owner
Home Financials are based on the most recent Mortgage that was taken out on this home.
Original Mortgage
$59,900
Interest Rate
7.05%
Create a Home Valuation Report for This Property
The Home Valuation Report is an in-depth analysis detailing your home's value as well as a comparison with similar homes in the area
Home Values in the Area
Average Home Value in this Area
Purchase History
| Date | Buyer | Sale Price | Title Company |
|---|---|---|---|
| Hall Carl W | -- | None Available | |
| Sky Bank | $46,000 | None Available | |
| Parks Larry E | $59,900 | -- |
Source: Public Records
Mortgage History
| Date | Status | Borrower | Loan Amount |
|---|---|---|---|
| Previous Owner | Parks Larry E | $59,900 |
Source: Public Records
Tax History Compared to Growth
Tax History
| Year | Tax Paid | Tax Assessment Tax Assessment Total Assessment is a certain percentage of the fair market value that is determined by local assessors to be the total taxable value of land and additions on the property. | Land | Improvement |
|---|---|---|---|---|
| 2024 | $1,219 | $28,490 | $4,670 | $23,820 |
| 2023 | $1,219 | $28,490 | $4,670 | $23,820 |
| 2022 | $1,085 | $21,630 | $3,730 | $17,900 |
| 2021 | $1,100 | $21,630 | $3,730 | $17,900 |
| 2020 | $1,054 | $21,630 | $3,730 | $17,900 |
| 2019 | $1,073 | $20,730 | $3,870 | $16,860 |
| 2018 | $1,077 | $20,730 | $3,870 | $16,860 |
| 2017 | $1,085 | $20,730 | $3,870 | $16,860 |
| 2016 | $1,033 | $19,520 | $3,870 | $15,650 |
| 2015 | $1,600 | $19,520 | $3,870 | $15,650 |
| 2014 | $1,117 | $19,520 | $3,870 | $15,650 |
Source: Public Records
Map
Nearby Homes