Estimated Value: $152,000 - $173,000
3
Beds
2
Baths
2,218
Sq Ft
$73/Sq Ft
Est. Value
About This Home
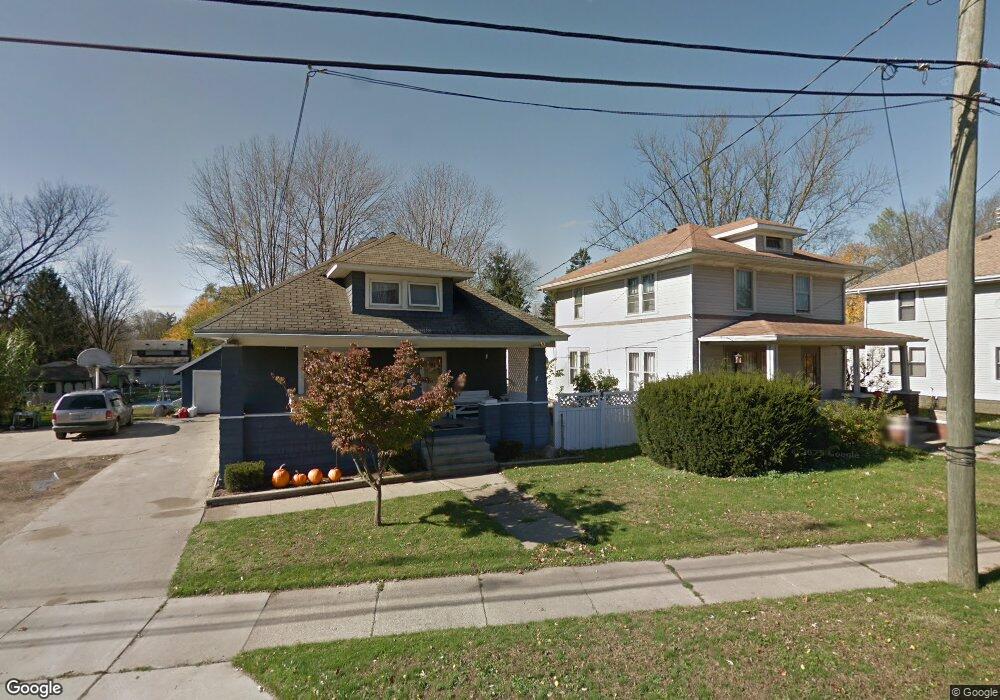
This home is located at 1020 N 5th St, Niles, MI 49120 and is currently estimated at $162,755, approximately $73 per square foot. 1020 N 5th St is a home located in Berrien County with nearby schools including James Ellis School, Howard-Ellis Elementary School, and Ring Lardner Middle School.
Ownership History
Date
Name
Owned For
Owner Type
Purchase Details
Closed on
Jan 4, 2008
Sold by
Allen Brannan G and Allen Angela S
Bought by
Peltz Carrie A
Current Estimated Value
Home Financials for this Owner
Home Financials are based on the most recent Mortgage that was taken out on this home.
Original Mortgage
$80,000
Outstanding Balance
$51,322
Interest Rate
6.13%
Mortgage Type
New Conventional
Estimated Equity
$104,856
Purchase Details
Closed on
Jul 3, 2002
Purchase Details
Closed on
Sep 29, 1987
Purchase Details
Closed on
Jun 12, 1986
Purchase Details
Closed on
Aug 14, 1980
Create a Home Valuation Report for This Property
The Home Valuation Report is an in-depth analysis detailing your home's value as well as a comparison with similar homes in the area
Home Values in the Area
Average Home Value in this Area
Purchase History
| Date | Buyer | Sale Price | Title Company |
|---|---|---|---|
| Peltz Carrie A | $80,000 | Chicago Title Of Michigan | |
| -- | $68,000 | -- | |
| -- | $21,500 | -- | |
| -- | $8,000 | -- | |
| -- | $8,000 | -- |
Source: Public Records
Mortgage History
| Date | Status | Borrower | Loan Amount |
|---|---|---|---|
| Open | Peltz Carrie A | $80,000 |
Source: Public Records
Tax History Compared to Growth
Tax History
| Year | Tax Paid | Tax Assessment Tax Assessment Total Assessment is a certain percentage of the fair market value that is determined by local assessors to be the total taxable value of land and additions on the property. | Land | Improvement |
|---|---|---|---|---|
| 2025 | $873 | $56,200 | $0 | $0 |
| 2024 | $672 | $56,100 | $0 | $0 |
| 2023 | $644 | $42,300 | $0 | $0 |
| 2022 | $613 | $30,000 | $0 | $0 |
| 2021 | $761 | $27,900 | $1,100 | $26,800 |
| 2020 | $753 | $27,200 | $0 | $0 |
| 2019 | $744 | $26,000 | $1,100 | $24,900 |
| 2018 | $719 | $26,000 | $0 | $0 |
| 2017 | $708 | $30,600 | $0 | $0 |
| 2016 | $693 | $24,200 | $0 | $0 |
| 2015 | $691 | $29,400 | $0 | $0 |
| 2014 | $533 | $25,200 | $0 | $0 |
Source: Public Records
Map
Nearby Homes