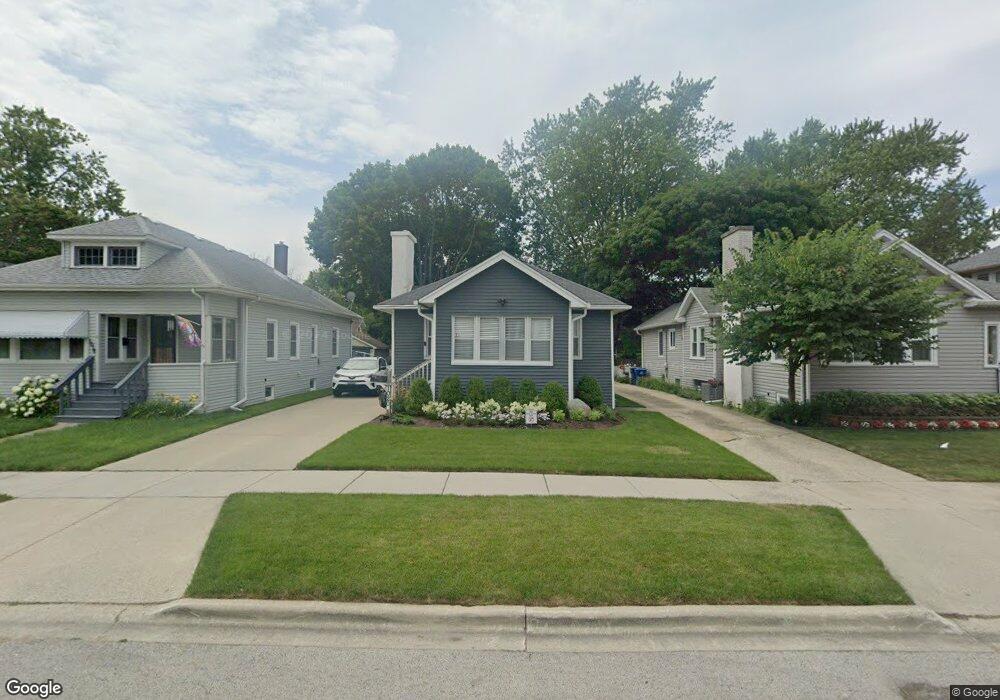
1020 N Ash St Waukegan, IL 60085
Estimated Value: $161,000 - $228,000
2
Beds
2
Baths
864
Sq Ft
$213/Sq Ft
Est. Value
About This Home
This home is located at 1020 N Ash St, Waukegan, IL 60085 and is currently estimated at $183,751, approximately $212 per square foot. 1020 N Ash St is a home located in Lake County with nearby schools including Glen Flora Elementary School, Edith M Smith Middle School, and Waukegan High School.
Ownership History
Date
Name
Owned For
Owner Type
Purchase Details
Closed on
Nov 2, 1999
Sold by
Galvan Augustine
Bought by
Ortiz Rocio
Current Estimated Value
Purchase Details
Closed on
May 5, 1995
Sold by
Peterson Glenn B and Chappell Peterson Sheila
Bought by
Galvan Augustin and Ortiz Rocio
Home Financials for this Owner
Home Financials are based on the most recent Mortgage that was taken out on this home.
Original Mortgage
$89,366
Interest Rate
8.43%
Mortgage Type
FHA
Purchase Details
Closed on
Mar 23, 1994
Sold by
Chappell Ana D
Bought by
Chappell Peterson Sheila and Peterson Glenn
Home Financials for this Owner
Home Financials are based on the most recent Mortgage that was taken out on this home.
Original Mortgage
$65,353
Interest Rate
7.27%
Mortgage Type
FHA
Purchase Details
Closed on
Feb 28, 1994
Sold by
Chappell Homer David
Bought by
Chappell Ana Delia
Home Financials for this Owner
Home Financials are based on the most recent Mortgage that was taken out on this home.
Original Mortgage
$65,353
Interest Rate
7.27%
Mortgage Type
FHA
Create a Home Valuation Report for This Property
The Home Valuation Report is an in-depth analysis detailing your home's value as well as a comparison with similar homes in the area
Home Values in the Area
Average Home Value in this Area
Purchase History
| Date | Buyer | Sale Price | Title Company |
|---|---|---|---|
| Ortiz Rocio | -- | -- | |
| Galvan Augustin | $90,000 | -- | |
| Chappell Peterson Sheila | $43,333 | -- | |
| Peterson Glenn B | $43,333 | -- | |
| Chappell Ana Delia | -- | -- |
Source: Public Records
Mortgage History
| Date | Status | Borrower | Loan Amount |
|---|---|---|---|
| Previous Owner | Galvan Augustin | $89,366 | |
| Previous Owner | Peterson Glenn B | $65,353 |
Source: Public Records
Tax History Compared to Growth
Tax History
| Year | Tax Paid | Tax Assessment Tax Assessment Total Assessment is a certain percentage of the fair market value that is determined by local assessors to be the total taxable value of land and additions on the property. | Land | Improvement |
|---|---|---|---|---|
| 2024 | $2,667 | $40,532 | $8,117 | $32,415 |
| 2023 | $2,784 | $36,288 | $7,267 | $29,021 |
| 2022 | $2,784 | $34,478 | $6,048 | $28,430 |
| 2021 | $2,584 | $30,788 | $5,396 | $25,392 |
| 2020 | $2,571 | $28,683 | $5,027 | $23,656 |
| 2019 | $2,535 | $26,283 | $4,606 | $21,677 |
| 2018 | $2,376 | $24,760 | $5,867 | $18,893 |
| 2017 | $2,280 | $21,906 | $5,191 | $16,715 |
| 2016 | $2,014 | $19,036 | $4,511 | $14,525 |
| 2015 | $1,864 | $17,037 | $4,037 | $13,000 |
| 2014 | $1,924 | $16,911 | $4,191 | $12,720 |
| 2012 | $2,605 | $18,323 | $4,541 | $13,782 |
Source: Public Records
Map
Nearby Homes
- 1110 N Ash St
- 918 N Ash St
- 415 W Ridgeland Ave
- 1336 N Ash St
- 1335 Chestnut St
- 917 N Linden Ave
- 1105 Woodlawn Cir
- 1312 N Linden Ave
- 620 N Poplar St
- 1109 Massena Ave
- 702 Franklin St
- 1000 Pine St
- 325 4th St
- 723 N County St
- 522 N Poplar St
- 511 Chestnut St
- 428 N Poplar St
- 824 N Butrick St
- 616 W Keith Ave
- 1018 W Atlantic Ave
- 1016 N Ash St
- 1022 N Ash St
- 1010 N Ash St
- 1028 N Ash St
- 1017 N Poplar St
- 1015 N Poplar St
- 1019 N Poplar St
- 1013 N Poplar St
- 1021 N Poplar St
- 1034 N Ash St
- 624 W Ridgeland Ave
- 1000 N Ash St
- 1031 N Poplar St
- 634 W Ridgeland Ave
- 1019 N Ash St
- 1015 N Ash St
- 1021 N Ash St
- 1011 N Ash St
- 1025 N Ash St
- 636 W Ridgeland Ave