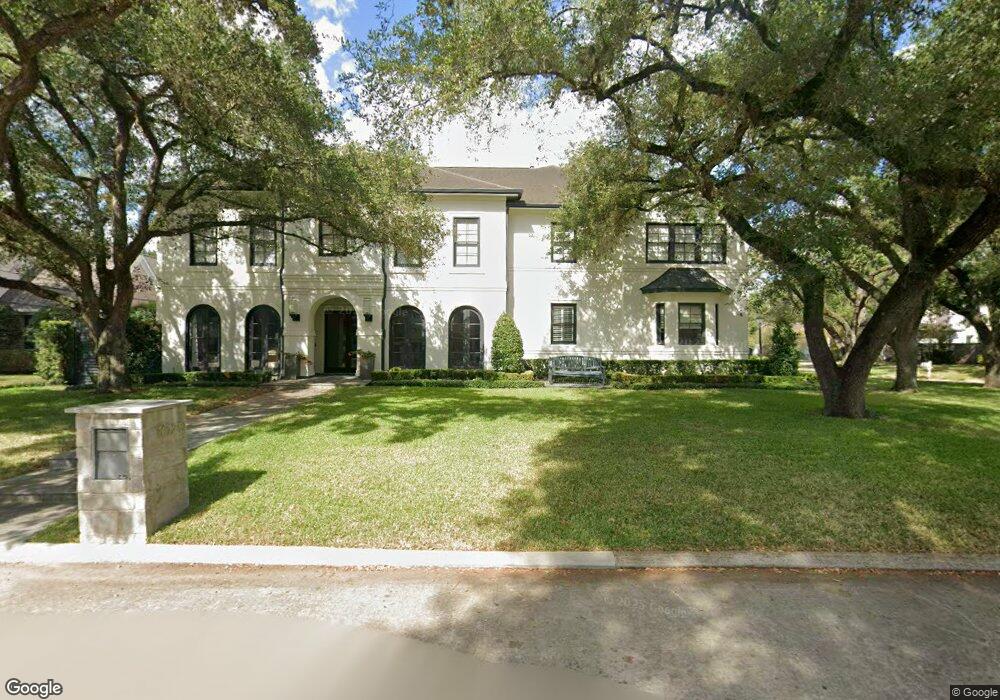
1020 River Glynn Dr Houston, TX 77063
Estimated Value: $2,373,886 - $2,833,000
5
Beds
6
Baths
6,386
Sq Ft
$407/Sq Ft
Est. Value
About This Home
This home is located at 1020 River Glynn Dr, Houston, TX 77063 and is currently estimated at $2,601,295, approximately $407 per square foot. 1020 River Glynn Dr is a home located in Harris County with nearby schools including Briargrove Elementary School, Tanglewood Middle, and Wisdom High School.
Ownership History
Date
Name
Owned For
Owner Type
Purchase Details
Closed on
Nov 18, 2016
Sold by
Rosenstein Cathy M and Rosenstein Greogory A
Bought by
Kalamaras Eric T and Kalamaras Stephanie M
Current Estimated Value
Home Financials for this Owner
Home Financials are based on the most recent Mortgage that was taken out on this home.
Original Mortgage
$1,305,600
Outstanding Balance
$1,070,665
Interest Rate
4.12%
Mortgage Type
Adjustable Rate Mortgage/ARM
Estimated Equity
$1,530,630
Purchase Details
Closed on
Mar 7, 2014
Sold by
Nishikawa Akira and Nishikawa Minami
Bought by
Rosenstein Cathy M and Rosenstein Gregory A
Home Financials for this Owner
Home Financials are based on the most recent Mortgage that was taken out on this home.
Original Mortgage
$1,428,744
Interest Rate
2.78%
Mortgage Type
Adjustable Rate Mortgage/ARM
Purchase Details
Closed on
May 3, 2000
Sold by
The Hunter Group Homebuilders Inc
Bought by
Nishikawa Akira and Nishikawa Minami
Home Financials for this Owner
Home Financials are based on the most recent Mortgage that was taken out on this home.
Original Mortgage
$250,000
Interest Rate
8.19%
Create a Home Valuation Report for This Property
The Home Valuation Report is an in-depth analysis detailing your home's value as well as a comparison with similar homes in the area
Home Values in the Area
Average Home Value in this Area
Purchase History
| Date | Buyer | Sale Price | Title Company |
|---|---|---|---|
| Kalamaras Eric T | -- | Stewart Title | |
| Rosenstein Cathy M | -- | Stewart Title | |
| Nishikawa Akira | -- | Stewart Title Company |
Source: Public Records
Mortgage History
| Date | Status | Borrower | Loan Amount |
|---|---|---|---|
| Open | Kalamaras Eric T | $1,305,600 | |
| Previous Owner | Rosenstein Cathy M | $1,428,744 | |
| Previous Owner | Nishikawa Akira | $250,000 |
Source: Public Records
Tax History Compared to Growth
Tax History
| Year | Tax Paid | Tax Assessment Tax Assessment Total Assessment is a certain percentage of the fair market value that is determined by local assessors to be the total taxable value of land and additions on the property. | Land | Improvement |
|---|---|---|---|---|
| 2025 | $31,881 | $2,588,784 | $799,092 | $1,789,692 |
| 2024 | $31,881 | $2,301,230 | $721,403 | $1,579,827 |
| 2023 | $31,881 | $2,106,147 | $610,418 | $1,495,729 |
| 2022 | $37,022 | $1,987,923 | $610,418 | $1,377,505 |
| 2021 | $45,380 | $2,345,244 | $610,418 | $1,734,826 |
| 2020 | $42,798 | $2,550,420 | $610,418 | $1,940,002 |
| 2019 | $42,524 | $2,000,000 | $499,433 | $1,500,567 |
| 2018 | $29,250 | $1,889,800 | $499,433 | $1,390,367 |
| 2017 | $43,313 | $2,037,100 | $499,433 | $1,537,667 |
| 2016 | $48,700 | $2,290,451 | $499,433 | $1,791,018 |
| 2015 | $27,754 | $2,020,333 | $499,433 | $1,520,900 |
| 2014 | $27,754 | $1,736,495 | $499,433 | $1,237,062 |
Source: Public Records
Map
Nearby Homes
- 1119 River Glynn Dr
- 1010 River Bend Dr
- 1006 River Glynn Dr
- 918 Huntington Cove
- 11 River Cir
- 6325 Riverview Way Unit ABCD
- 11095 Memorial Dr
- 821 S Ripple Creek Dr Unit 1
- 1229 Ripple Creek Dr
- 6311 Riverview Way
- 6304 Riverview Way
- 7508 Creekwood Dr
- 6401 Bayou Glen Rd
- 6338 Crab Orchard Rd
- 674 S Ripple Creek Dr Unit 674
- 6326 Crab Orchard Rd
- 630 S Ripple Creek Dr Unit 631
- 205 Fleetway Dr
- 811 Wild Valley Rd
- 642 S Ripple Creek Dr Unit 642
- 7516 Riverview Way
- 1018 River Glynn Dr
- 7503 Riverview Way
- 1021 River Glynn Dr
- 1013 River Bend Dr
- 1017 River Glynn Dr
- 1014 River Glynn Dr
- 7511 Riverview Way
- 8 S Voss Rd
- 1009 River Bend Dr
- 1103 River Glyn Dr
- 7517 Riverview Way
- 1103 River Glynn Dr
- 1013 River Glynn Dr
- 1005 River Bend Dr
- 1108 River Glynn Dr
- 1010 River Glynn Dr
- 1107 River Glynn Dr
- 1105 River Bend Dr
- 1112 River Glynn Dr