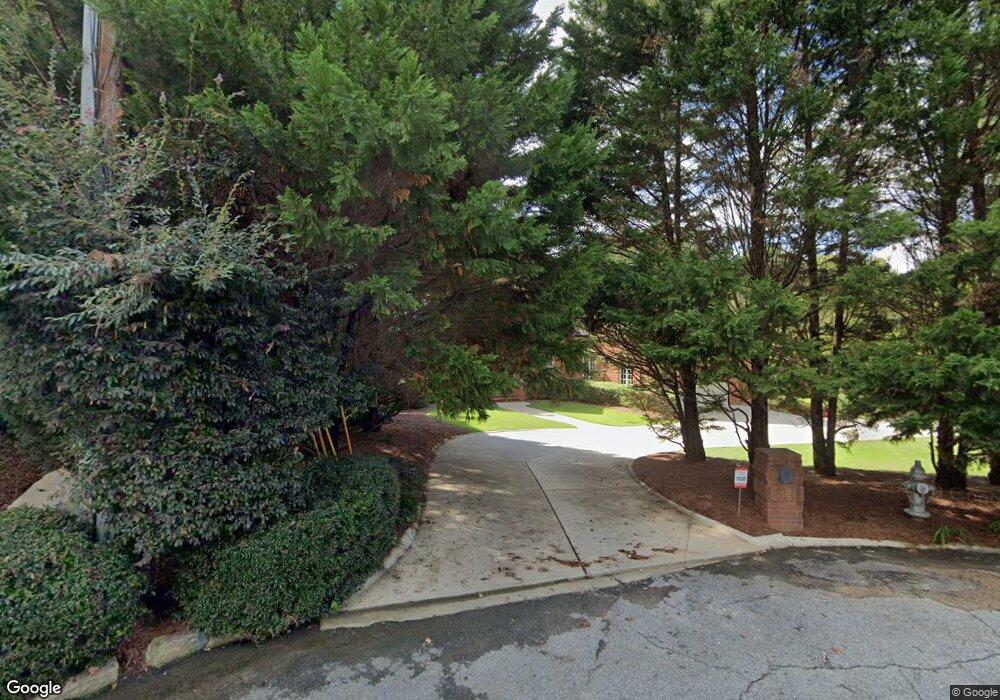
1020 Robin Ln NE Atlanta, GA 30306
Morningside NeighborhoodEstimated Value: $2,267,000 - $2,982,000
4
Beds
5
Baths
4,460
Sq Ft
$583/Sq Ft
Est. Value
About This Home
This home is located at 1020 Robin Ln NE, Atlanta, GA 30306 and is currently estimated at $2,601,498, approximately $583 per square foot. 1020 Robin Ln NE is a home located in Fulton County with nearby schools including Morningside Elementary School, Midtown High School, and Carlisle Montessori School of Buckhead.
Ownership History
Date
Name
Owned For
Owner Type
Purchase Details
Closed on
Dec 29, 2011
Sold by
Brandwine Mark J
Bought by
Carrano Richard A and Carrano Angela D
Current Estimated Value
Home Financials for this Owner
Home Financials are based on the most recent Mortgage that was taken out on this home.
Original Mortgage
$975,000
Outstanding Balance
$670,984
Interest Rate
4.06%
Mortgage Type
New Conventional
Estimated Equity
$1,930,514
Purchase Details
Closed on
Dec 21, 2011
Sold by
Brandwine Melissa T
Bought by
Brandwine Mark J
Home Financials for this Owner
Home Financials are based on the most recent Mortgage that was taken out on this home.
Original Mortgage
$975,000
Outstanding Balance
$670,984
Interest Rate
4.06%
Mortgage Type
New Conventional
Estimated Equity
$1,930,514
Purchase Details
Closed on
Aug 31, 1999
Sold by
Brandwine Mark J
Bought by
Brandwine Mark T and Brandwine Melissa T
Create a Home Valuation Report for This Property
The Home Valuation Report is an in-depth analysis detailing your home's value as well as a comparison with similar homes in the area
Home Values in the Area
Average Home Value in this Area
Purchase History
| Date | Buyer | Sale Price | Title Company |
|---|---|---|---|
| Carrano Richard A | $1,475,000 | -- | |
| Brandwine Mark J | -- | -- | |
| Brandwine Mark T | -- | -- |
Source: Public Records
Mortgage History
| Date | Status | Borrower | Loan Amount |
|---|---|---|---|
| Open | Carrano Richard A | $975,000 | |
| Closed | Brandwine Mark J | $975,000 |
Source: Public Records
Tax History Compared to Growth
Tax History
| Year | Tax Paid | Tax Assessment Tax Assessment Total Assessment is a certain percentage of the fair market value that is determined by local assessors to be the total taxable value of land and additions on the property. | Land | Improvement |
|---|---|---|---|---|
| 2025 | $28,414 | $940,000 | $190,400 | $749,600 |
| 2023 | $41,408 | $1,000,200 | $190,400 | $809,800 |
| 2022 | $35,996 | $889,440 | $131,600 | $757,840 |
| 2021 | $31,656 | $927,000 | $127,760 | $799,240 |
| 2020 | $32,012 | $781,440 | $167,480 | $613,960 |
| 2019 | $490 | $767,640 | $164,520 | $603,120 |
| 2018 | $31,350 | $757,240 | $144,880 | $612,360 |
| 2017 | $31,119 | $720,520 | $139,320 | $581,200 |
| 2016 | $31,199 | $720,520 | $139,320 | $581,200 |
| 2015 | $31,765 | $720,520 | $139,320 | $581,200 |
| 2014 | $26,116 | $576,000 | $111,360 | $464,640 |
Source: Public Records
Map
Nearby Homes
- 1770 Merton Rd NE
- 1143 Morningside Place NE
- 1109 Morningside Place NE
- 879 Wildwood Rd NE
- 1835 Wellbourne Dr NE
- 1818 Homestead Ave NE
- 962 Plymouth Rd NE
- 1987 Wellbourne Dr NE
- 1960 Wellbourne Dr NE
- 1634 Lenox Rd NE
- 1910 Windham Park NE
- 1990 Wellbourne Dr NE Unit 5
- 1990 Wellbourne Drive Northeast #7 Dr NE Unit 7
- 1656 N Pelham Rd NE
- 2086 Lenox Rd NE
- 1590 Johnson Rd NE
- 1751 N Pelham Rd NE
- 1905 Windemere Dr NE
- 1027 Robin Ln NE
- 1026 Robin Ln NE
- 1035 Robin Ln NE
- 1034 Robin Ln NE
- 998 Wildwood Rd NE
- 1006 Wildwood Rd NE
- 988 Wildwood Rd NE
- 1043 Robin Ln NE
- 1016 Wildwood Rd NE Unit 10
- 1042 Robin Ln NE
- 978 Wildwood Rd NE
- 1024 Wildwood Rd NE
- 1055 Robin Ln NE
- 1054 Robin Ln NE
- 968 Wildwood Rd NE
- 1032 Wildwood Rd NE
- 1780 Merton Rd NE
- 1067 Robin Ln NE
- 1042 Wildwood Rd NE
- 960 Wildwood Rd NE